💬 Yesterday a client asked me:
“Generally, another important element is ACLs — but in a way that I can select topics easier with a GUI instead of using only wildcards, since I need very granular ACLs.”
☕️ I decided to implement it – my date with a lovely woman got canceled today, by her 🤨, so I suddenly had some extra time.
It was straightforward – almost everything in MonsterMQ can be configured through its GraphQL API, so building such a page was easy.
Now, ACL management just got a lot more user-friendly.
⚙️ Next up: I’m working on a lightweight flow engine, so transformations can be implemented directly in the broker – in JavaScript, but still running where the data flows.
👉 MonsterMQ.com
🧩 MonsterMQ – Groundhog Day
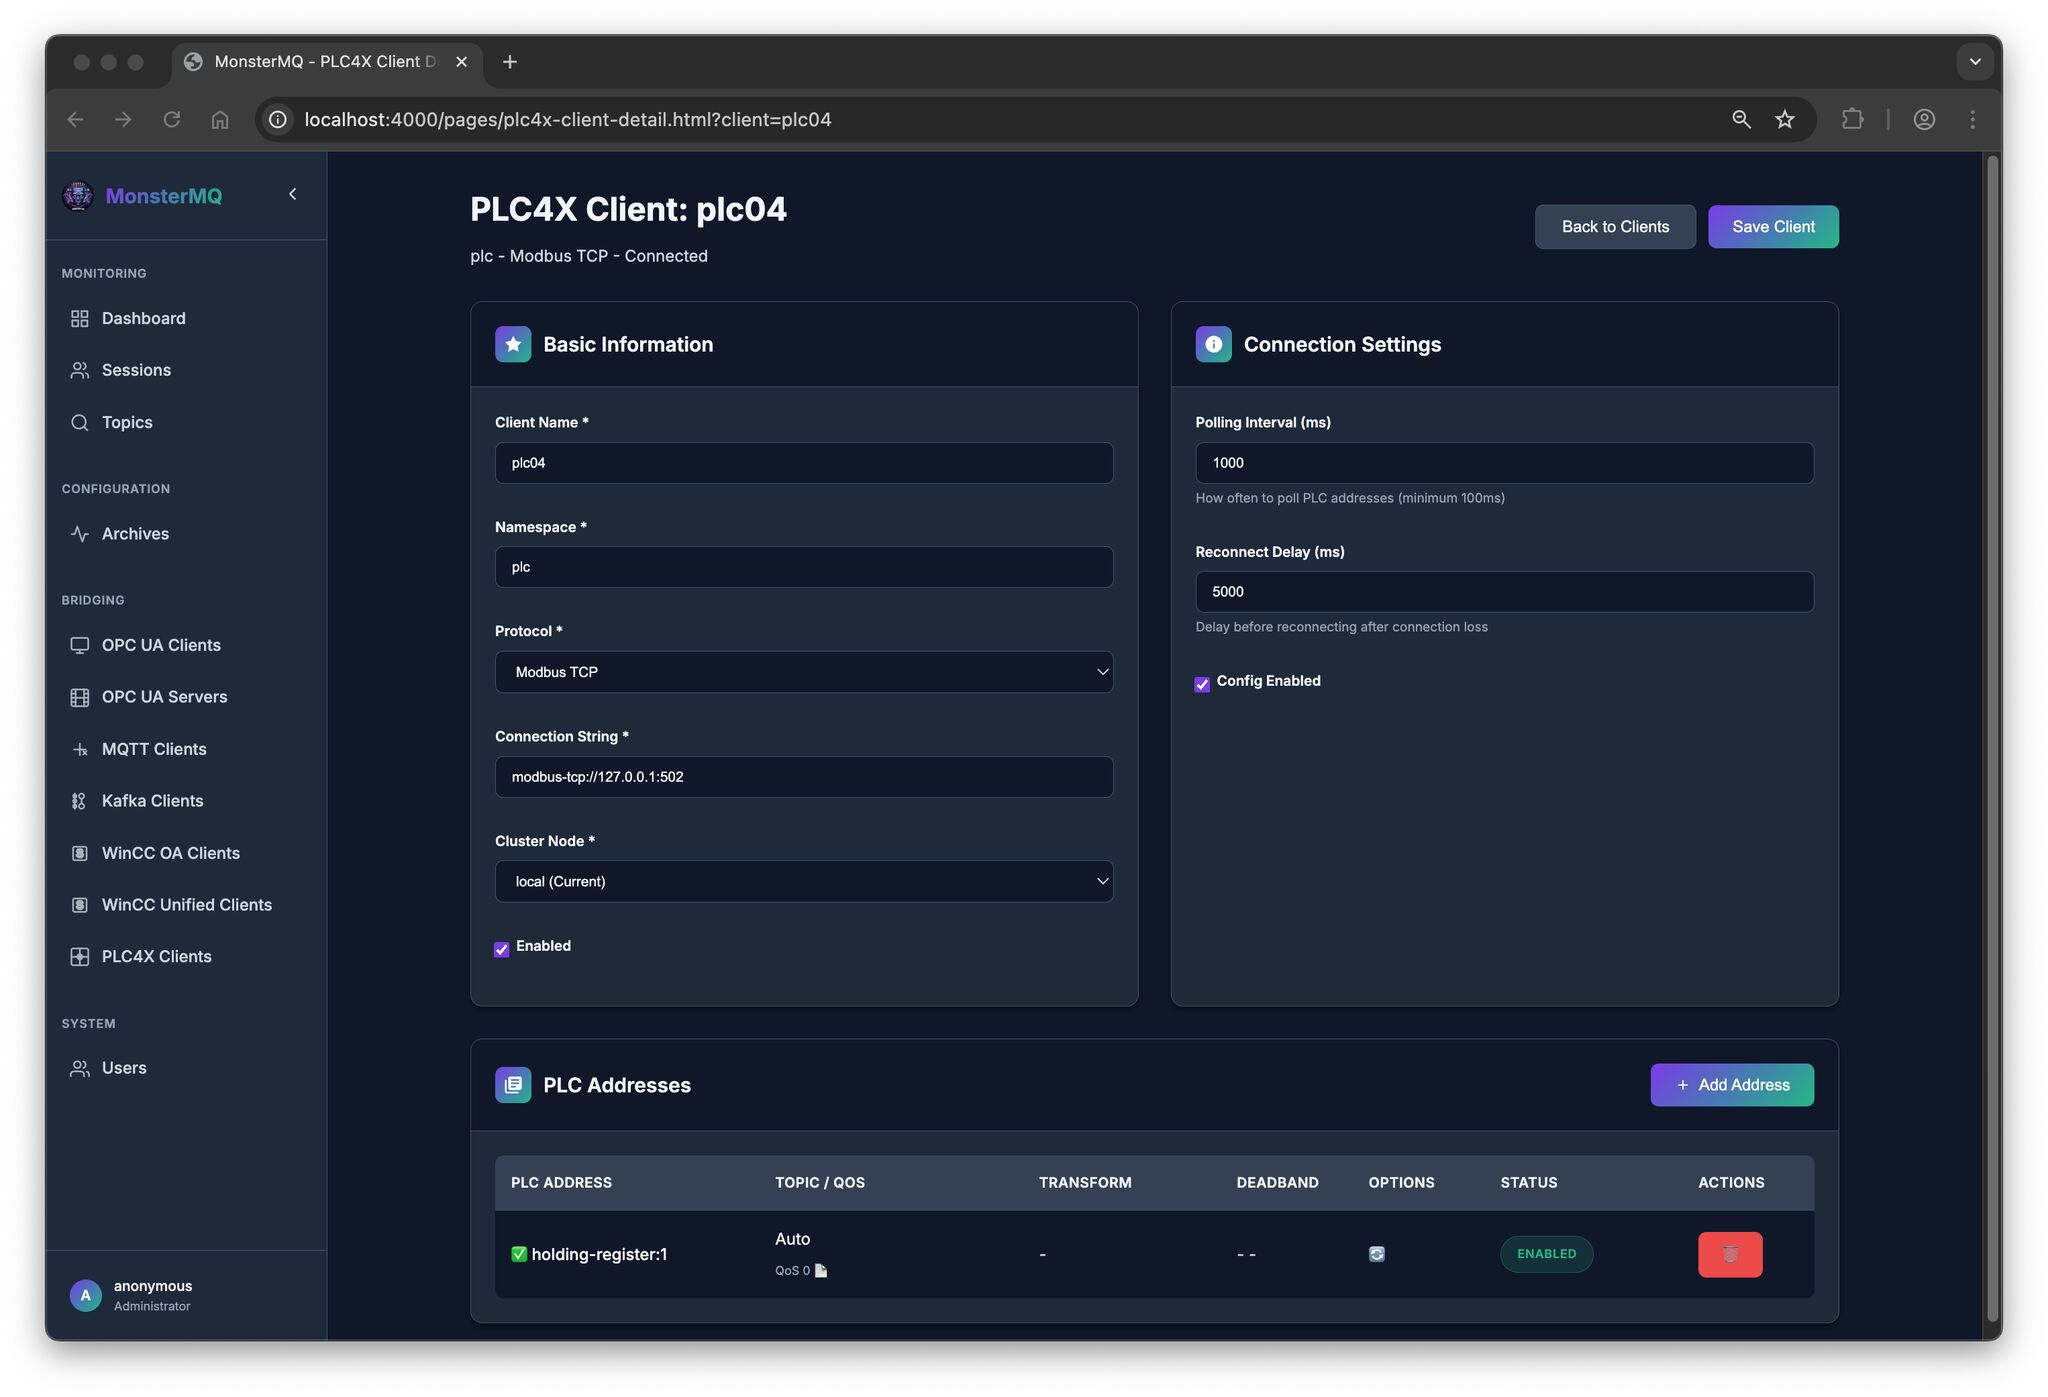
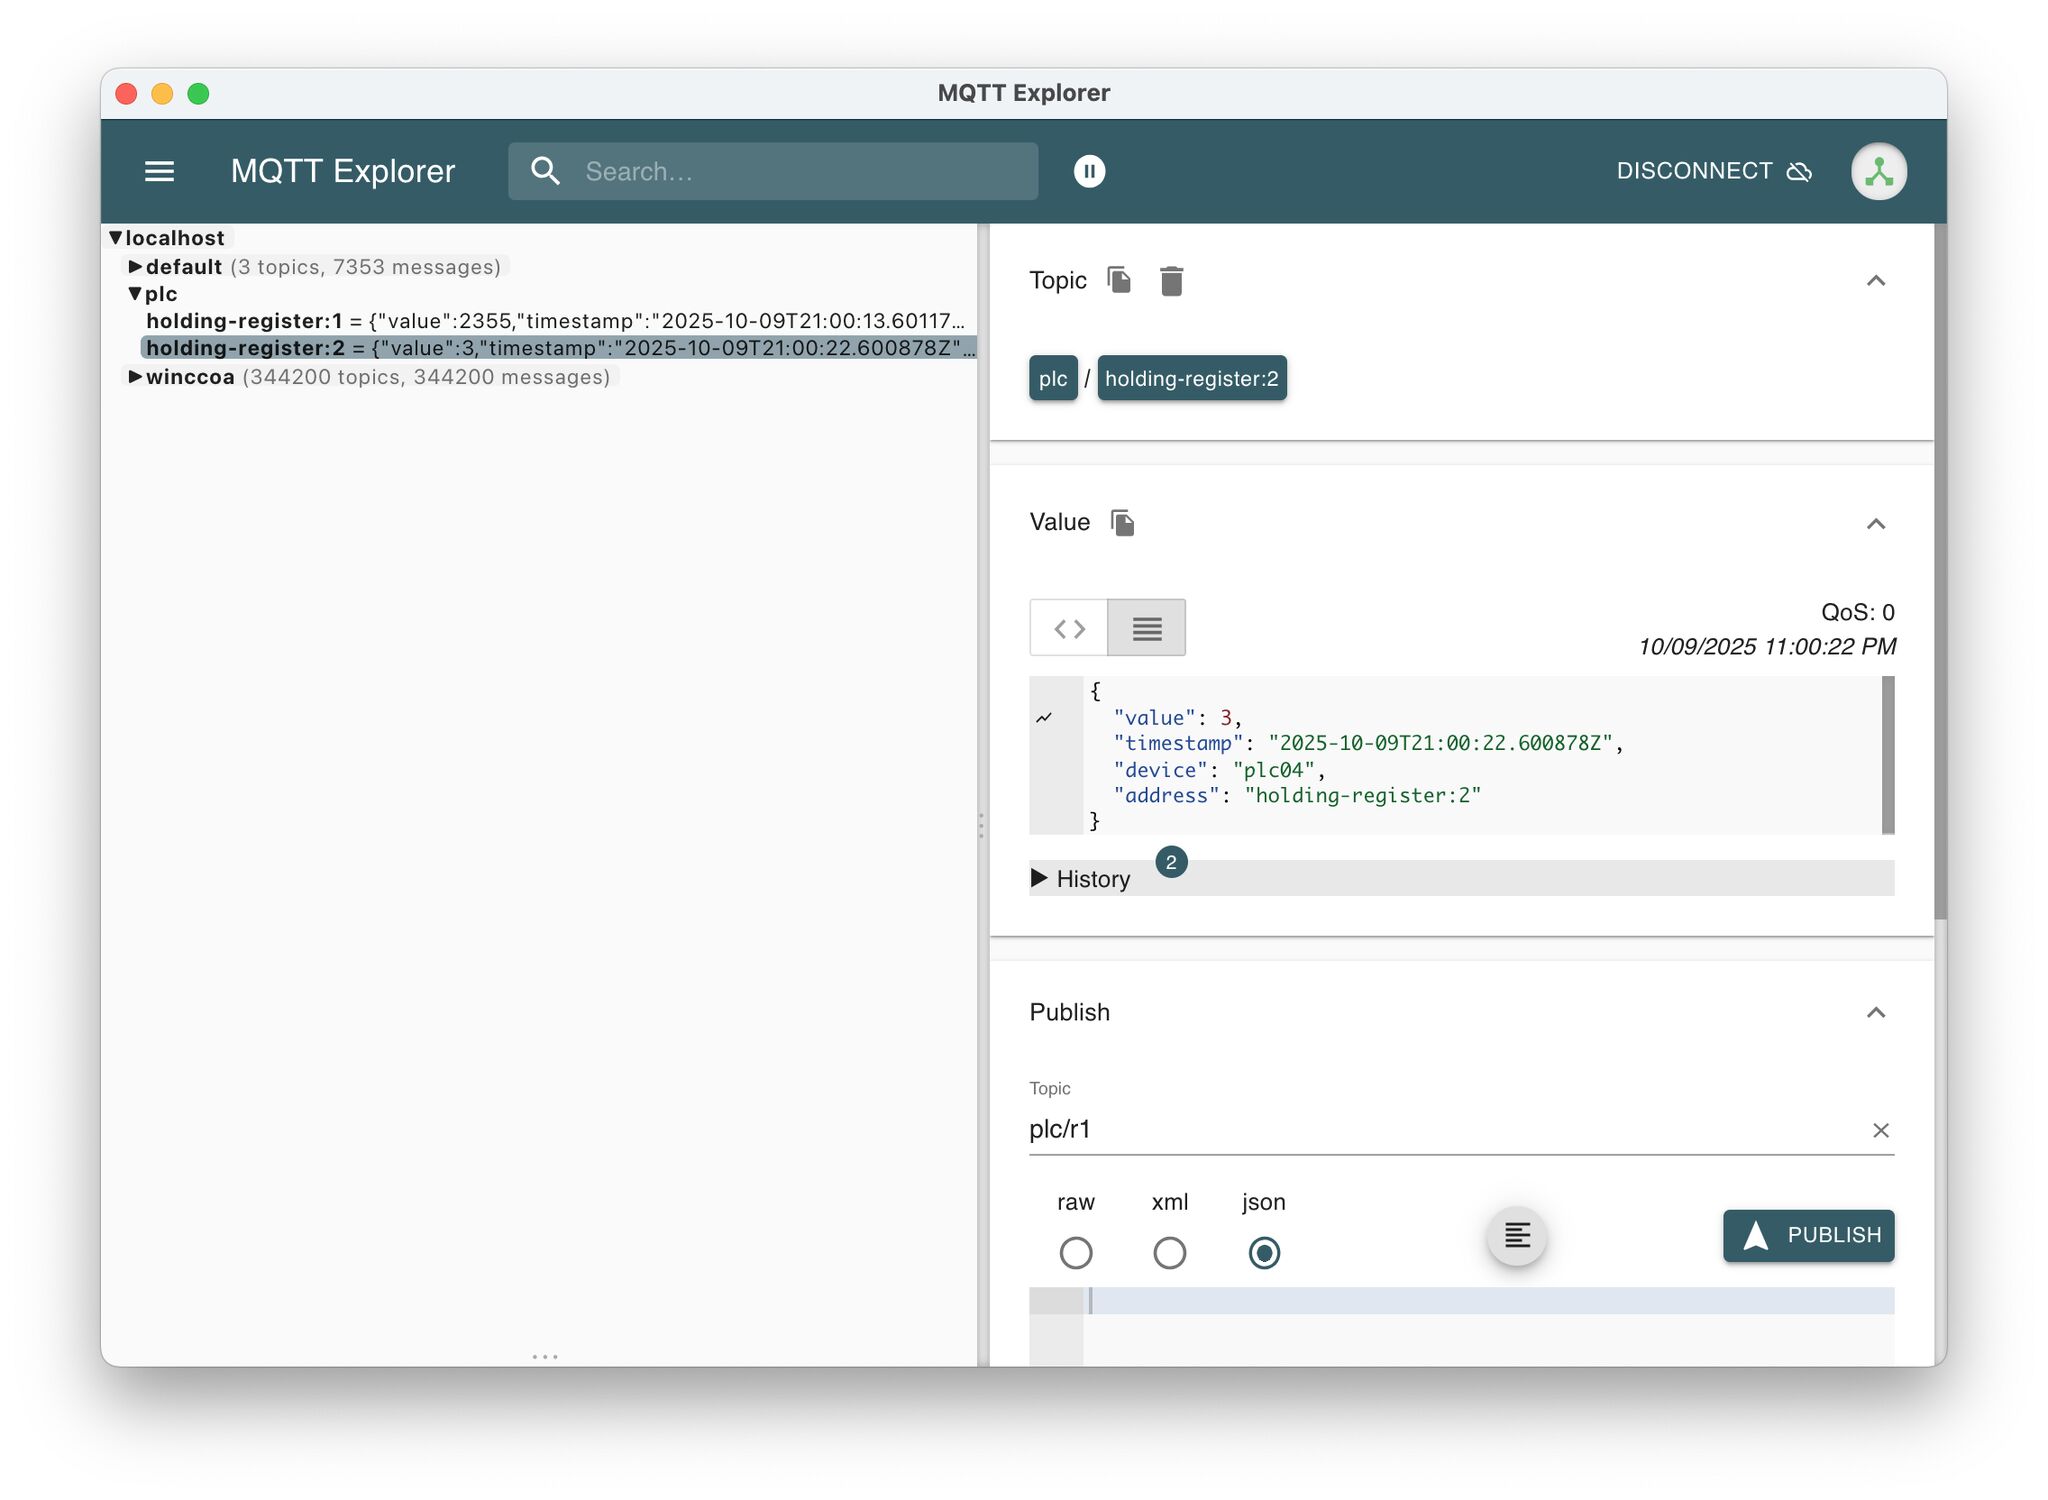
Every day (or night) a new feature – I’ve now added PLC4X
MonsterMQ becomes also a gateway, collecting data from the field to MQTT and can forwarding it to higher layers.
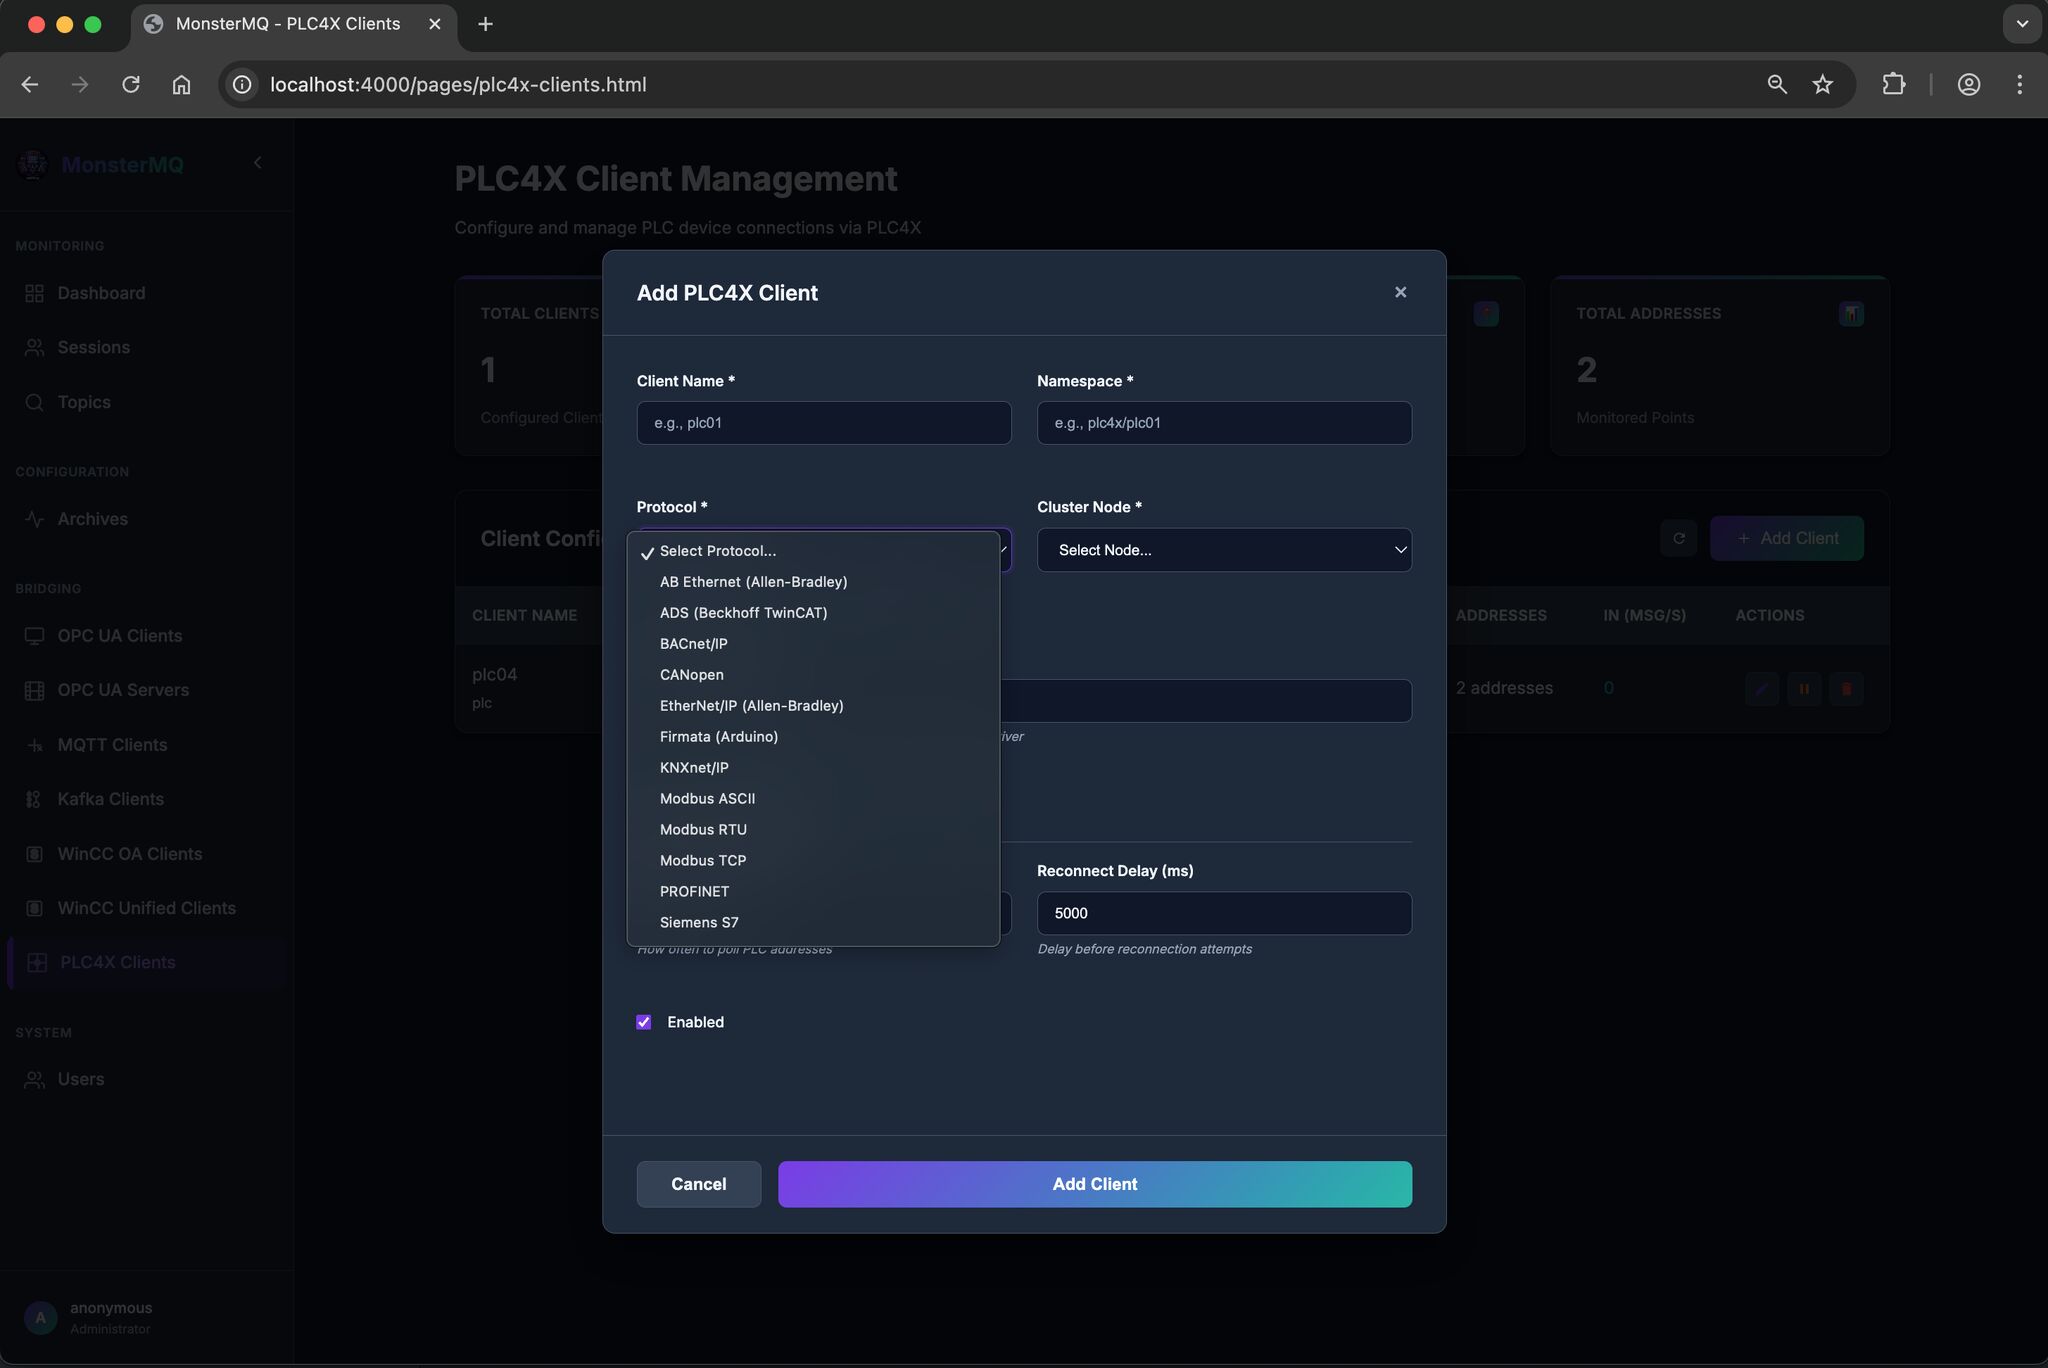
I’ve only tested it with Modbus so far, would be great if others could try it with more PLCs and protocols. See the picture for the list of supported ones.
If you like it, star it on GitHub: MonsterMQ.com
🐉 MonsterMQ – Connecting SCADA to MQTT – Open-Source!
In the newest version, MonsterMQ can now receive tags, events, and alerts directly from WinCC Open Architecture and WinCC Unified.
The broker connects to your SCADA systems and brings the data into MonsterMQ. From there, you can use it however you want, for analytics, dashboards, or integration with other systems.
It can also bring OPC UA data natively into the broker, making it a bridge between the OT and IT worlds.
And if you already have an enterprise MQTT broker, MonsterMQ can act as a gateway, forwarding the data to another broker.
Please star MonsterMQ on GitHub and let me know if some tutorials and videos would be helpful. https://lnkd.in/dqPKFCNQ
🔗 MonsterMQ.com
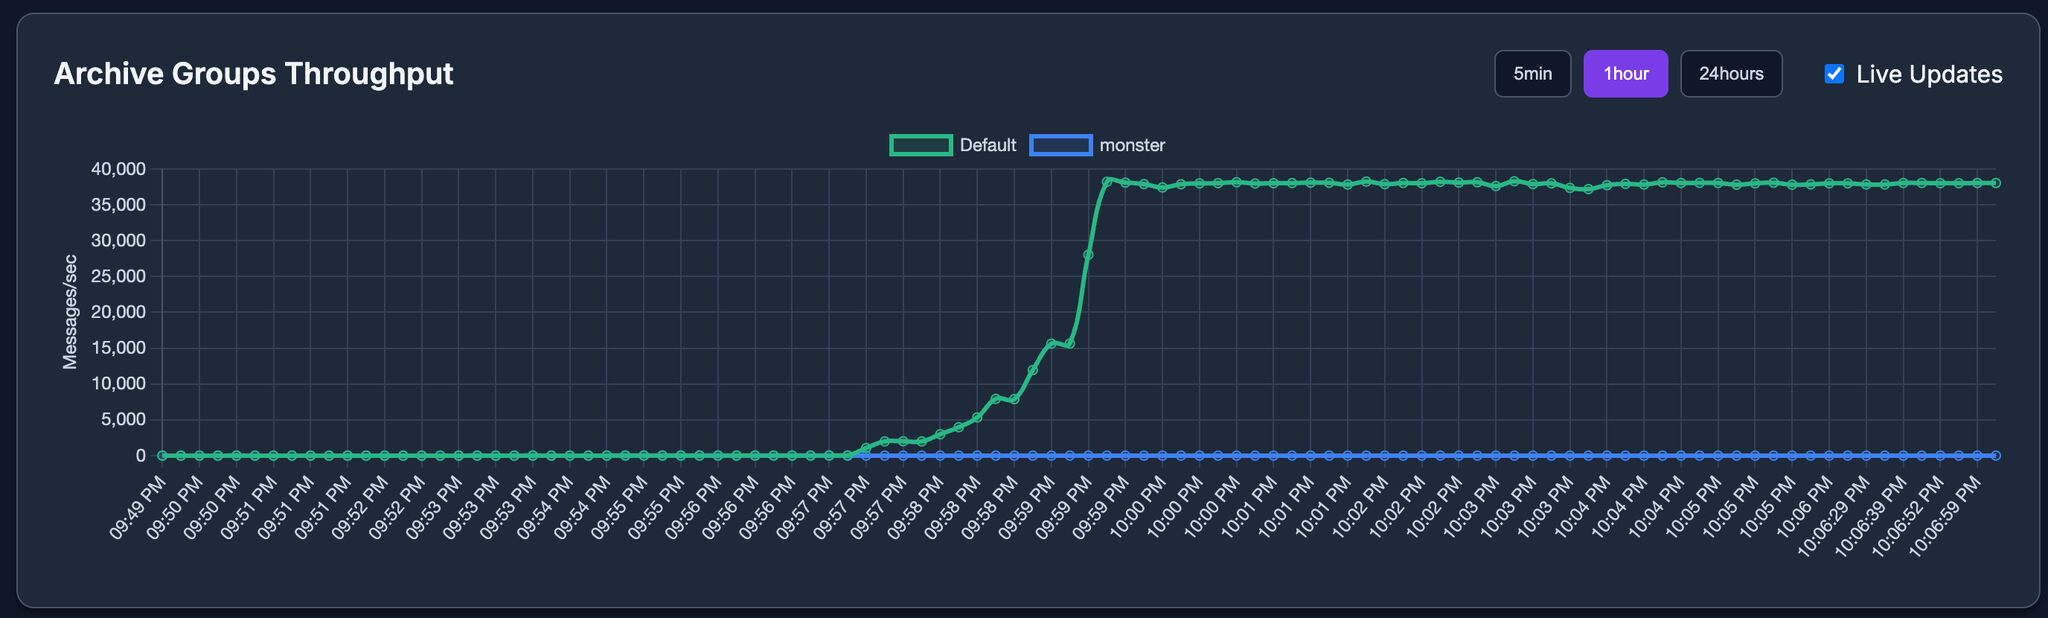
🚀 MonsterMQ & SIEMENS SCADA… just a teaser…
Currently testing a new connectivity for MonsterMQ.com – bringing WinCC Open Architecture tags into the broker via the WinCC OA GraphQL Server!
It was great to see that with 5,000,000 tags (datapoint elements in OA) and a 40 kHz simulation (40,000 value changes per second!), a single WinCC OA GraphQL Server can easily handle that load via GraphQL Subscriptions — even on commodity hardware! 💪
🤨 Why not publish the tags from WinCC OA with its MQTT capabilities? Because the MQTT protocol doesn’t support bulk messages, it’s not efficient for transferring a large number of topic value changes.
💡And I am using WinCC OA’s great continuous SQL queries, which makes it possible to subscribe to 5 Millions tags with just a single SQL query.
MonsterMQ.com will soon get a bridge to WinCC OA 🥳 Stay tuned. And WinCC Unified will be next 😀
Weekend is over 👉 New version of MonsterMQ 🧌
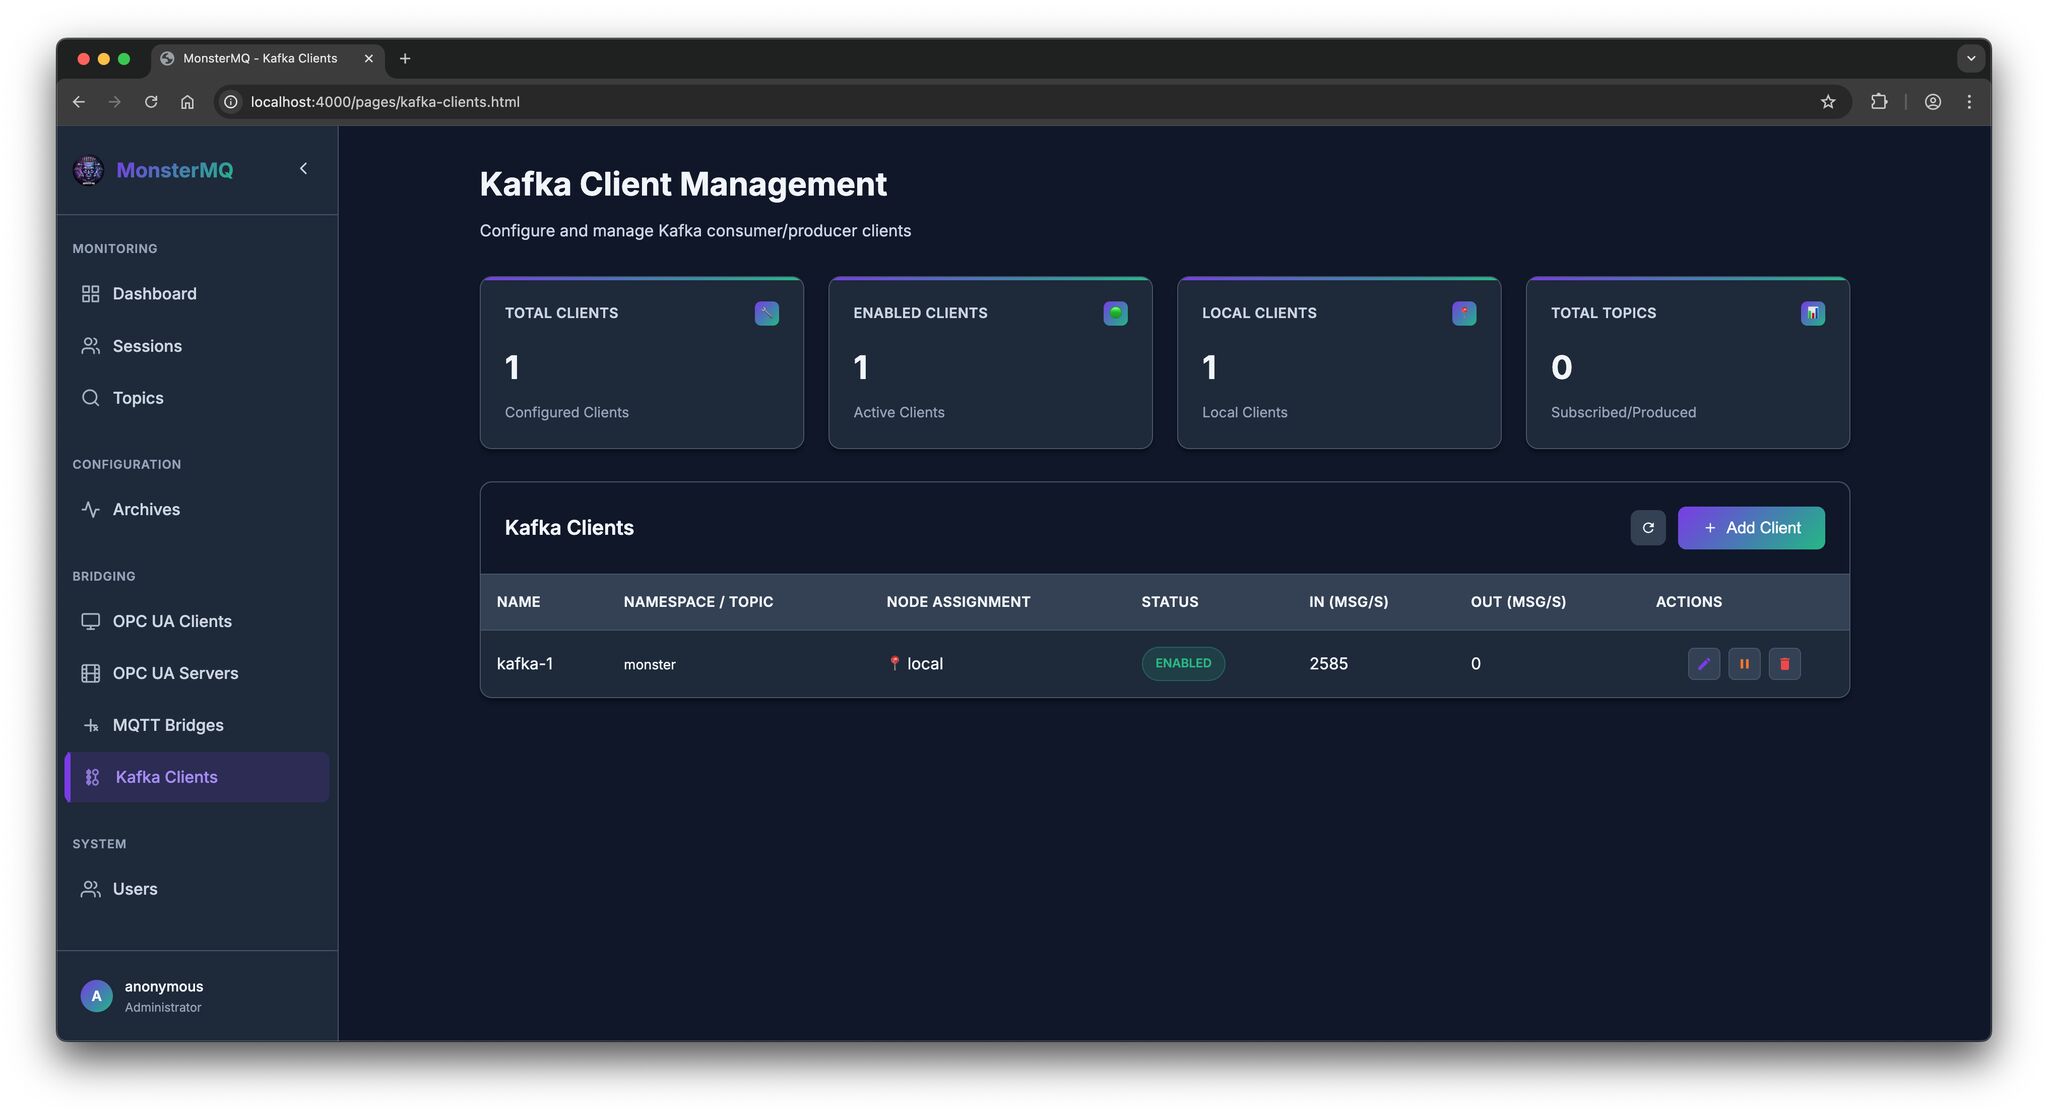
🚨 Breaking News: We’ve added Kafka Client functionality!
It acts as a consumer, enabling data replication from one MQTT Broker instance to another, together with the Kafka Archiving – using a fast, reliable, and bandwidth-optimized Kafka protocol and broker.
👉 Sending data from local MQTT brokers to the cloud is much more efficient by using Kafka.
And this release brings also some more improvements! We’ve reworked metric handling:
👉 Metrics are now shown as values per second
👉 Added metrics for OPC UA Client, OPC UA Server, and MQTT Bridges, Archiving (to databases).
MonsterMQ.com


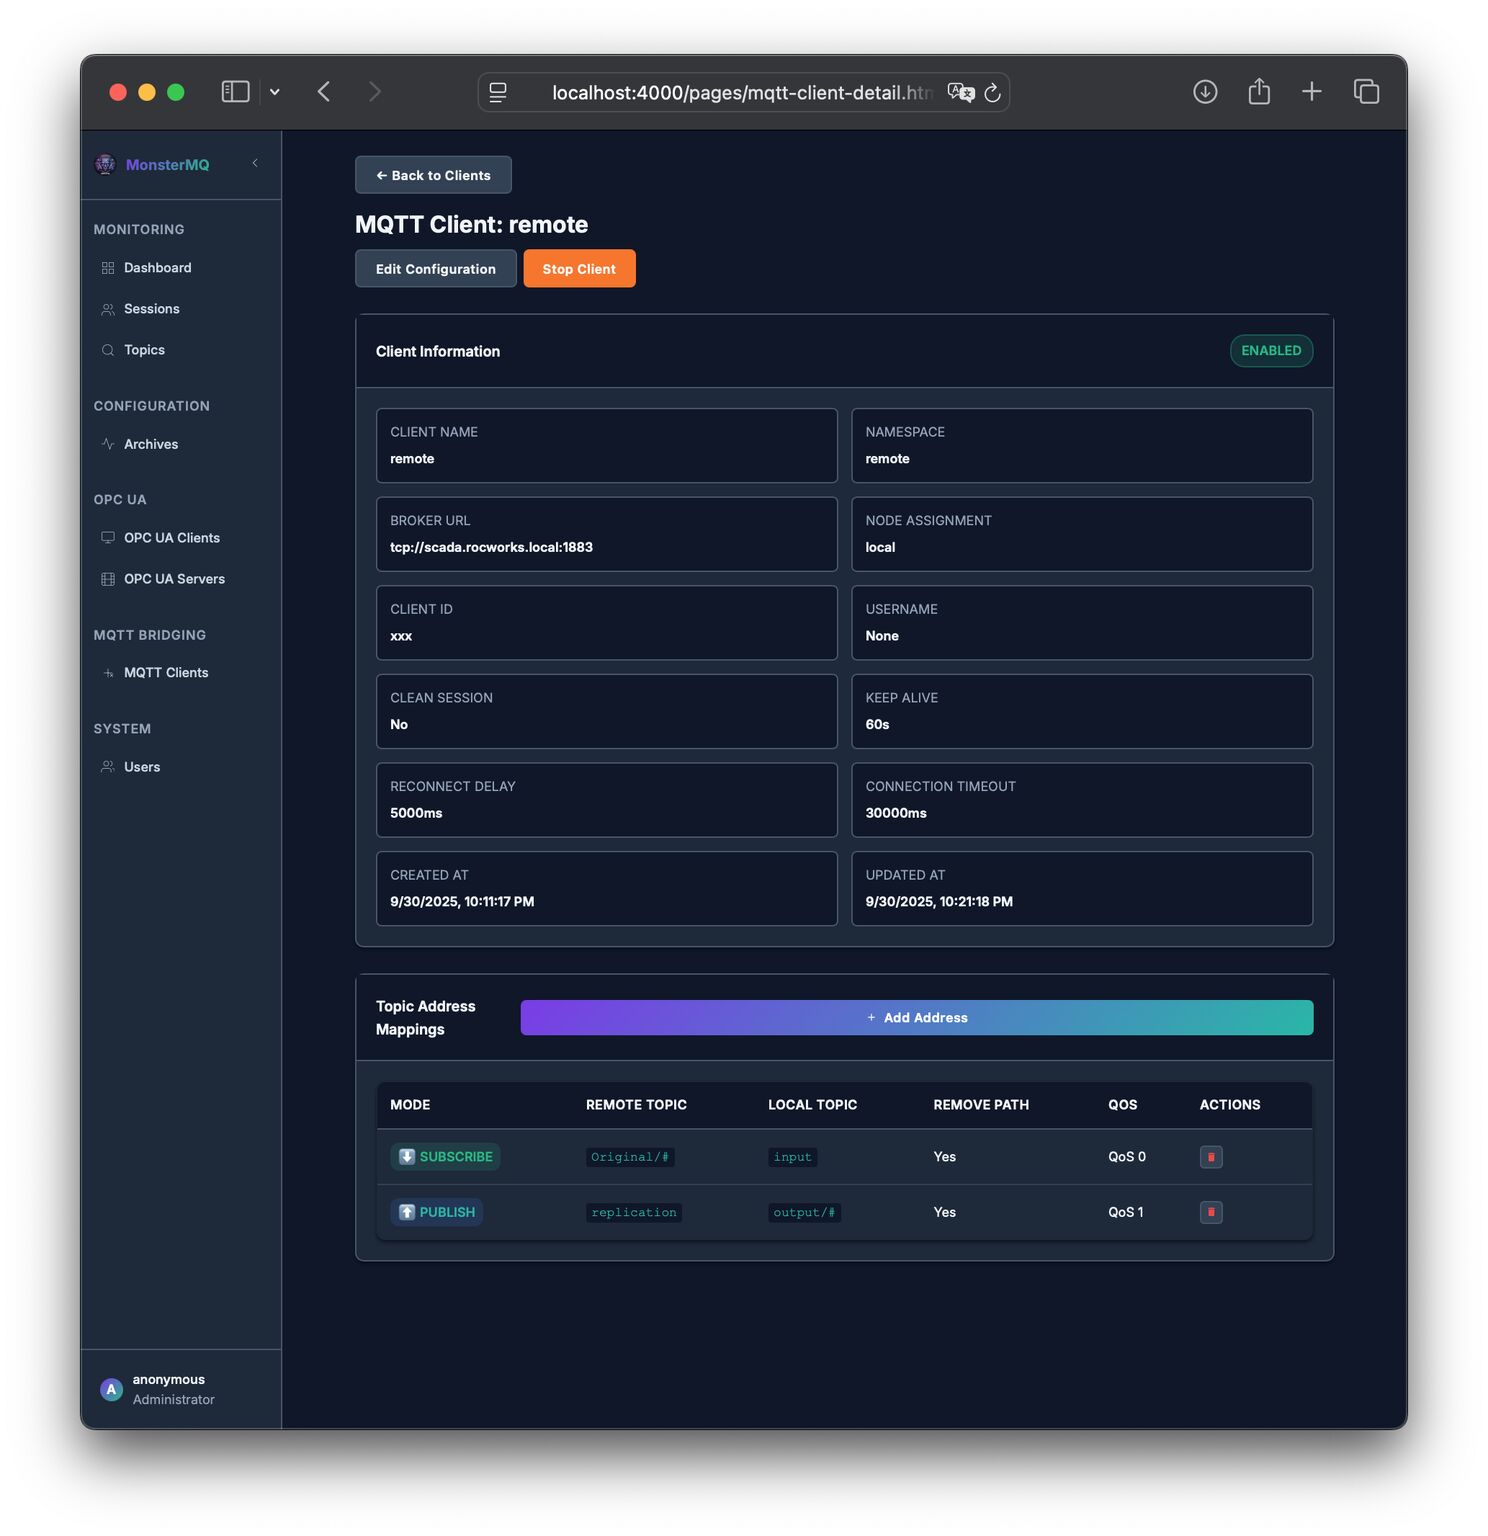
🚀 Again a MonsterMQ Update: MQTT-to-MQTT Replication
You can:
👉 Connect to other brokers and publish local topics to the remote one
👉 Subscribe to remote topics and bring them into your local broker
💡 Both directions work with wildcards
This makes it easier to link brokers across sites, clouds, or edge setups.
And after this update… we’ll take a short break 😉 even though I already have more ideas for features…
Please give a ⭐️ on GitHub if you like the project!
Open-Source 🔗 MonsterMQ.com

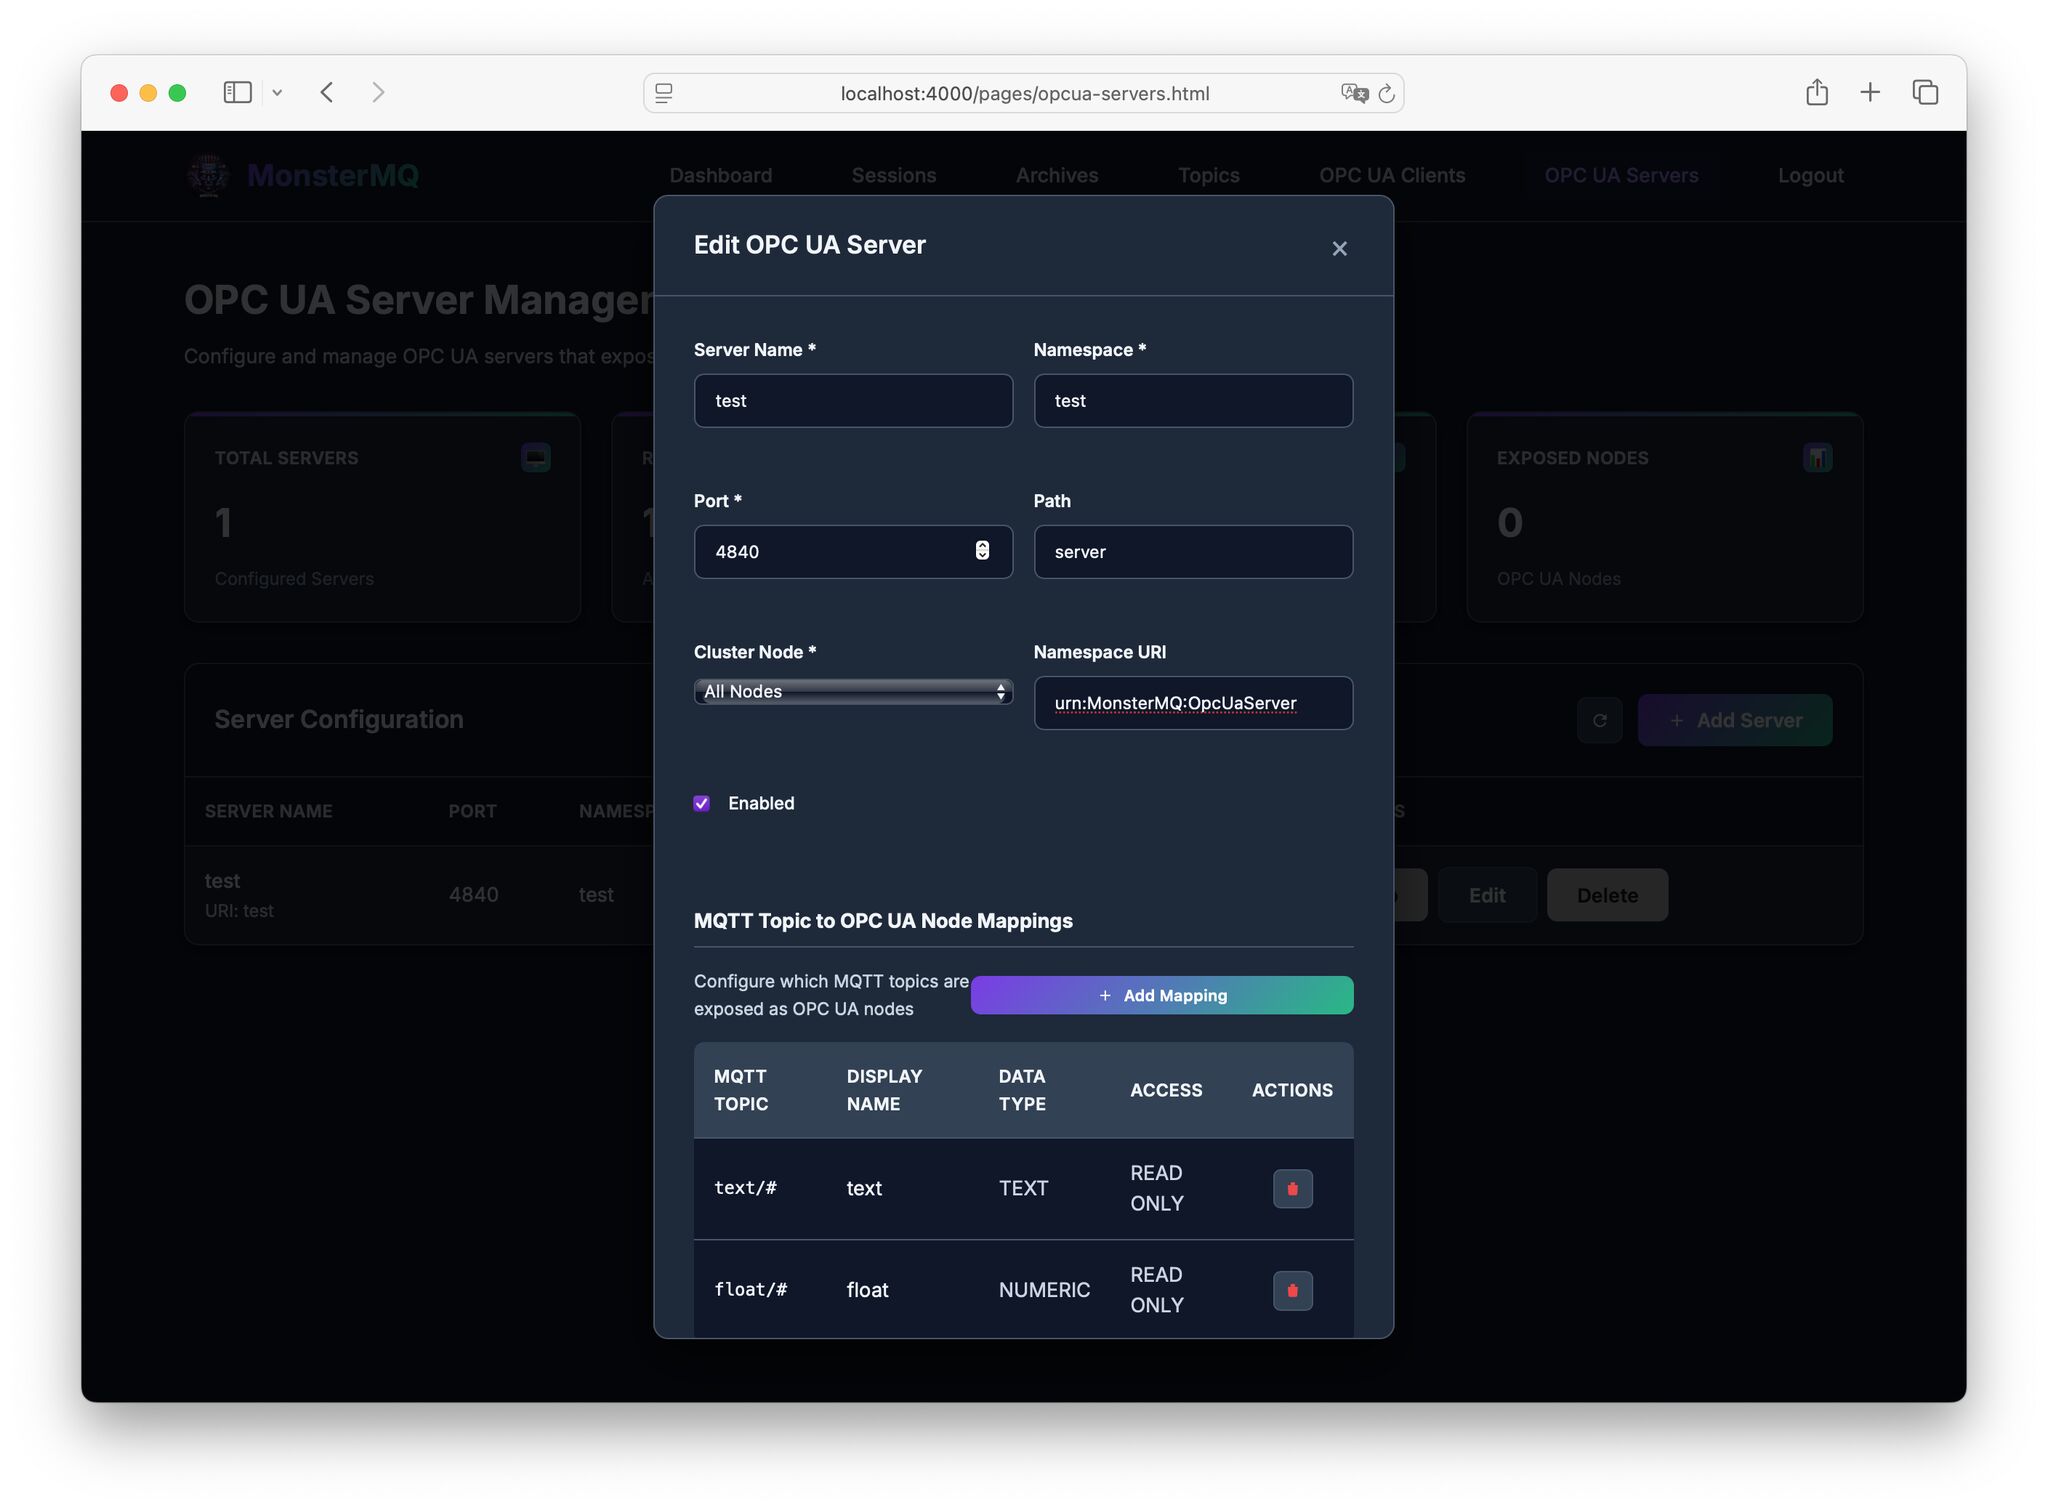
🧌 MonsterMQ now comes with an OPC UA Server!
You can configure MQTT topics (with wildcards) to be available via OPC UA.
This means:
👉 Ingest data into the broker via MQTT.
👉 Expose MQTT data as an OPC UA Server.
👉 And there’s also an integrated OPC UA Client to bring values from OPC UA Servers into the broker.
A IT/OT integration layer, bridging OPC UA and MQTT in both directions.
🔗 https://monstermq.com


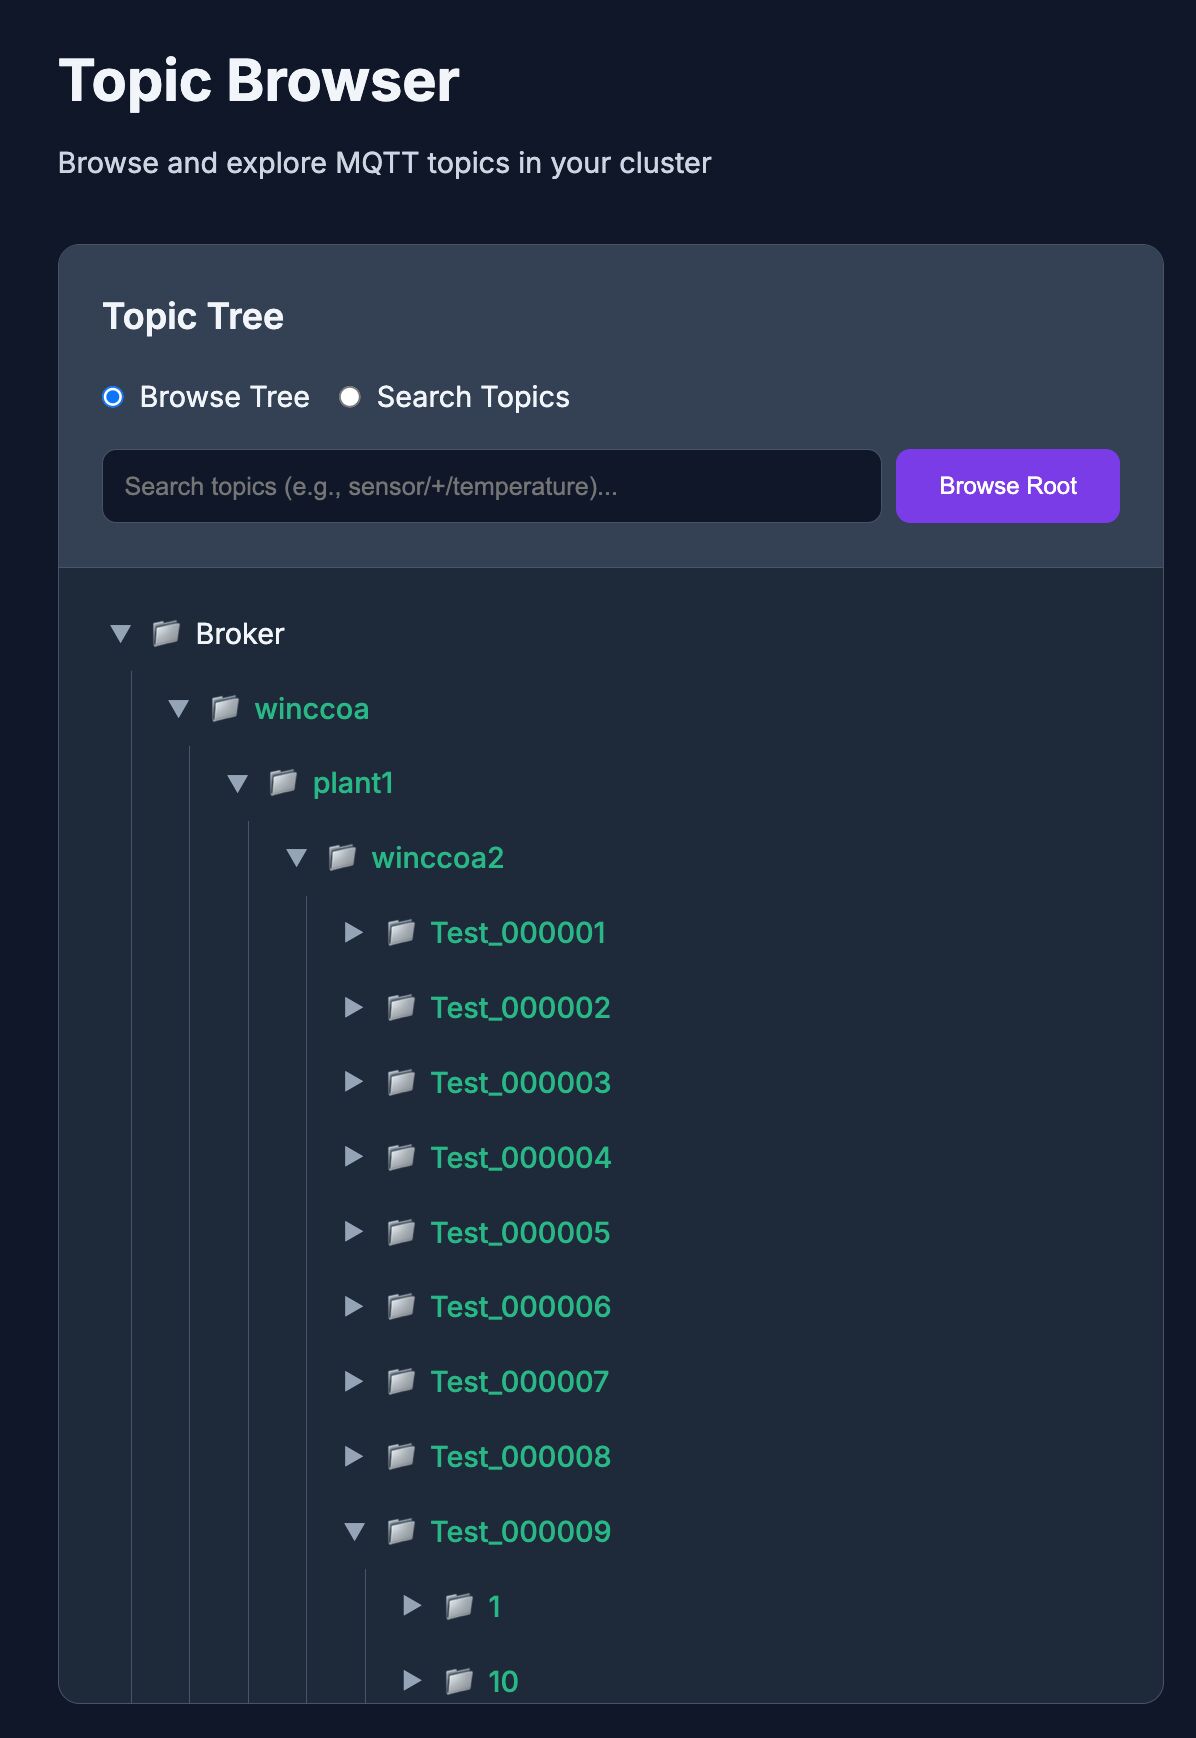
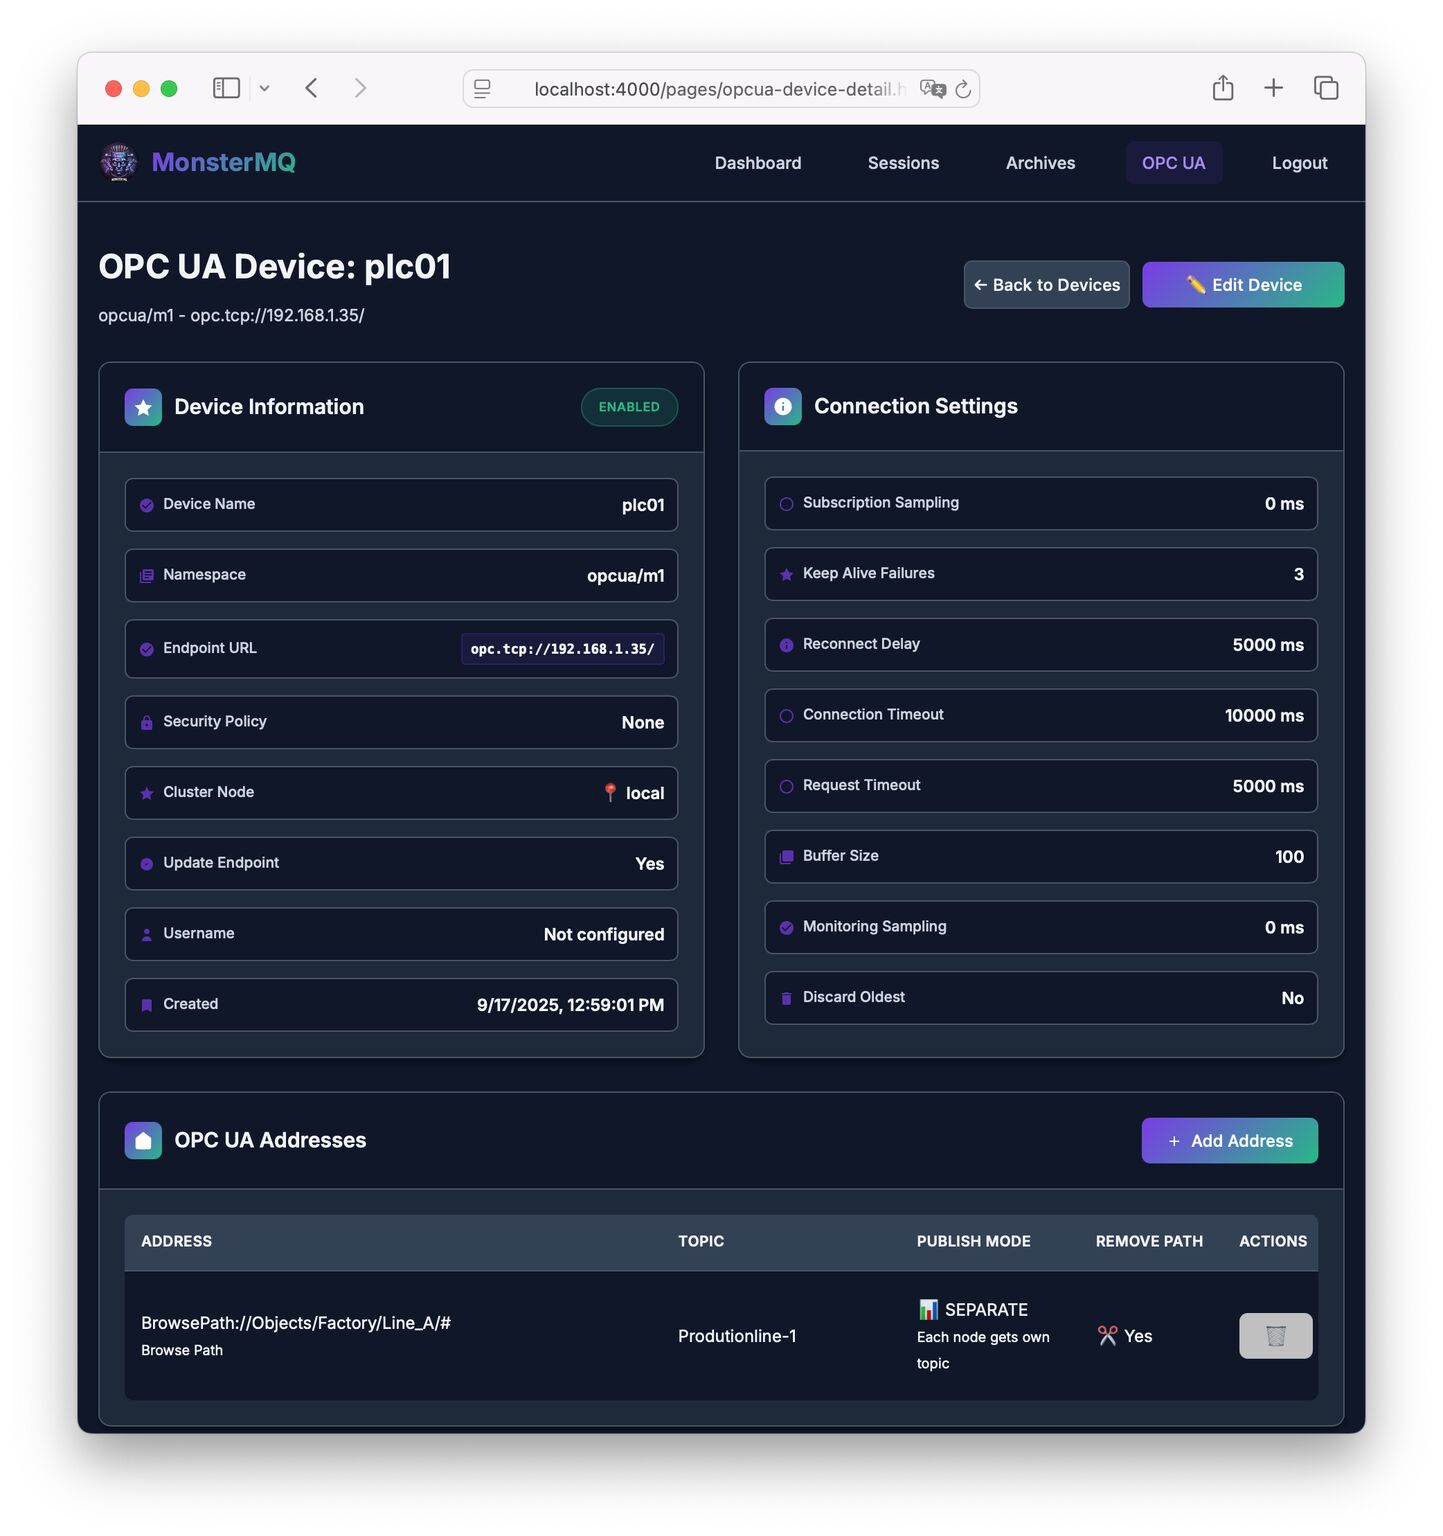
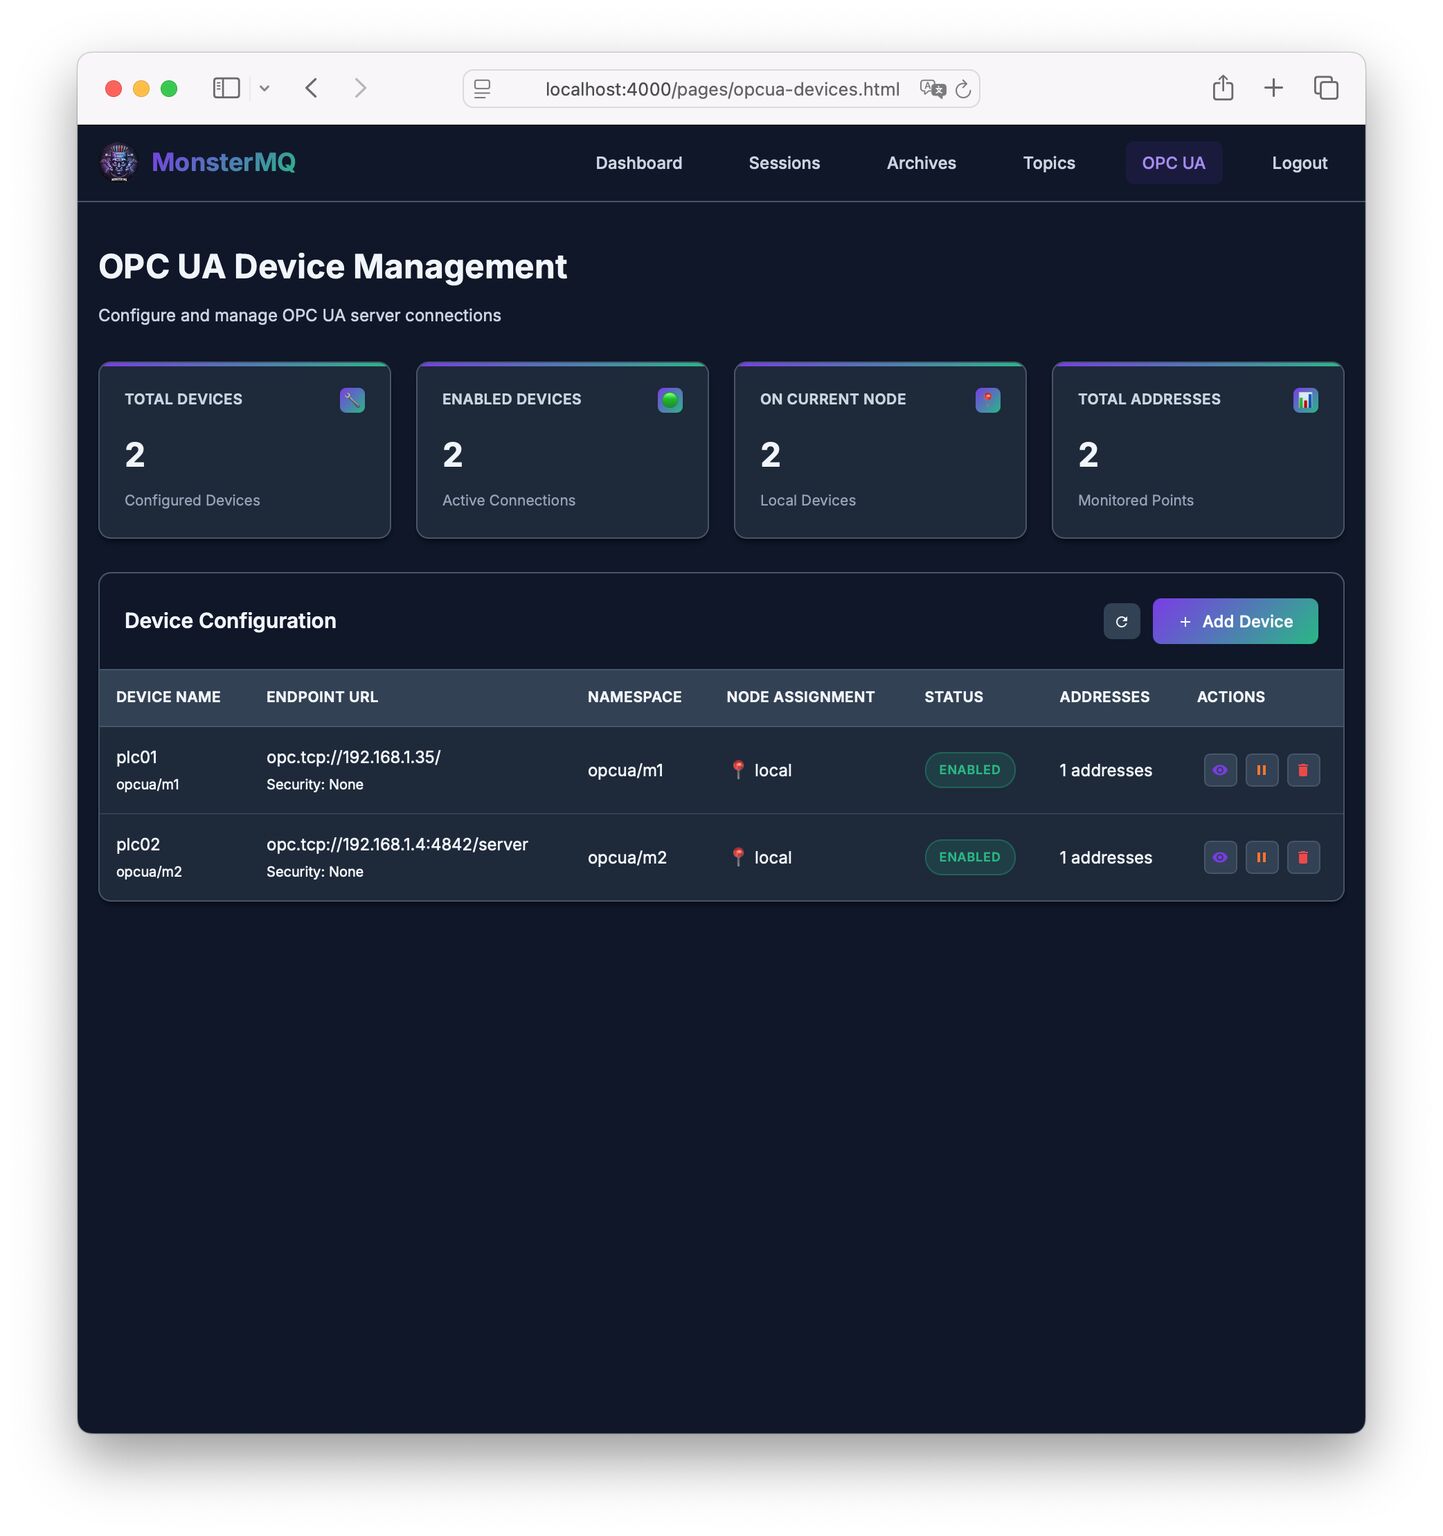
🚀 Nightly new Feature in MonsterMQ: OPC UA Server Connectivity!
With this integration, MonsterMQ can now connect directly to OPC UA Servers and make the data available on MQTT topics — bridging two key industrial protocols.
Plus we have integrated a topic tree browser, see pics!
I took a half day off work, to finish this.
🔗 https://monstermq.com – Open-Source 👍
👉 Star it on GitHub if you like it!


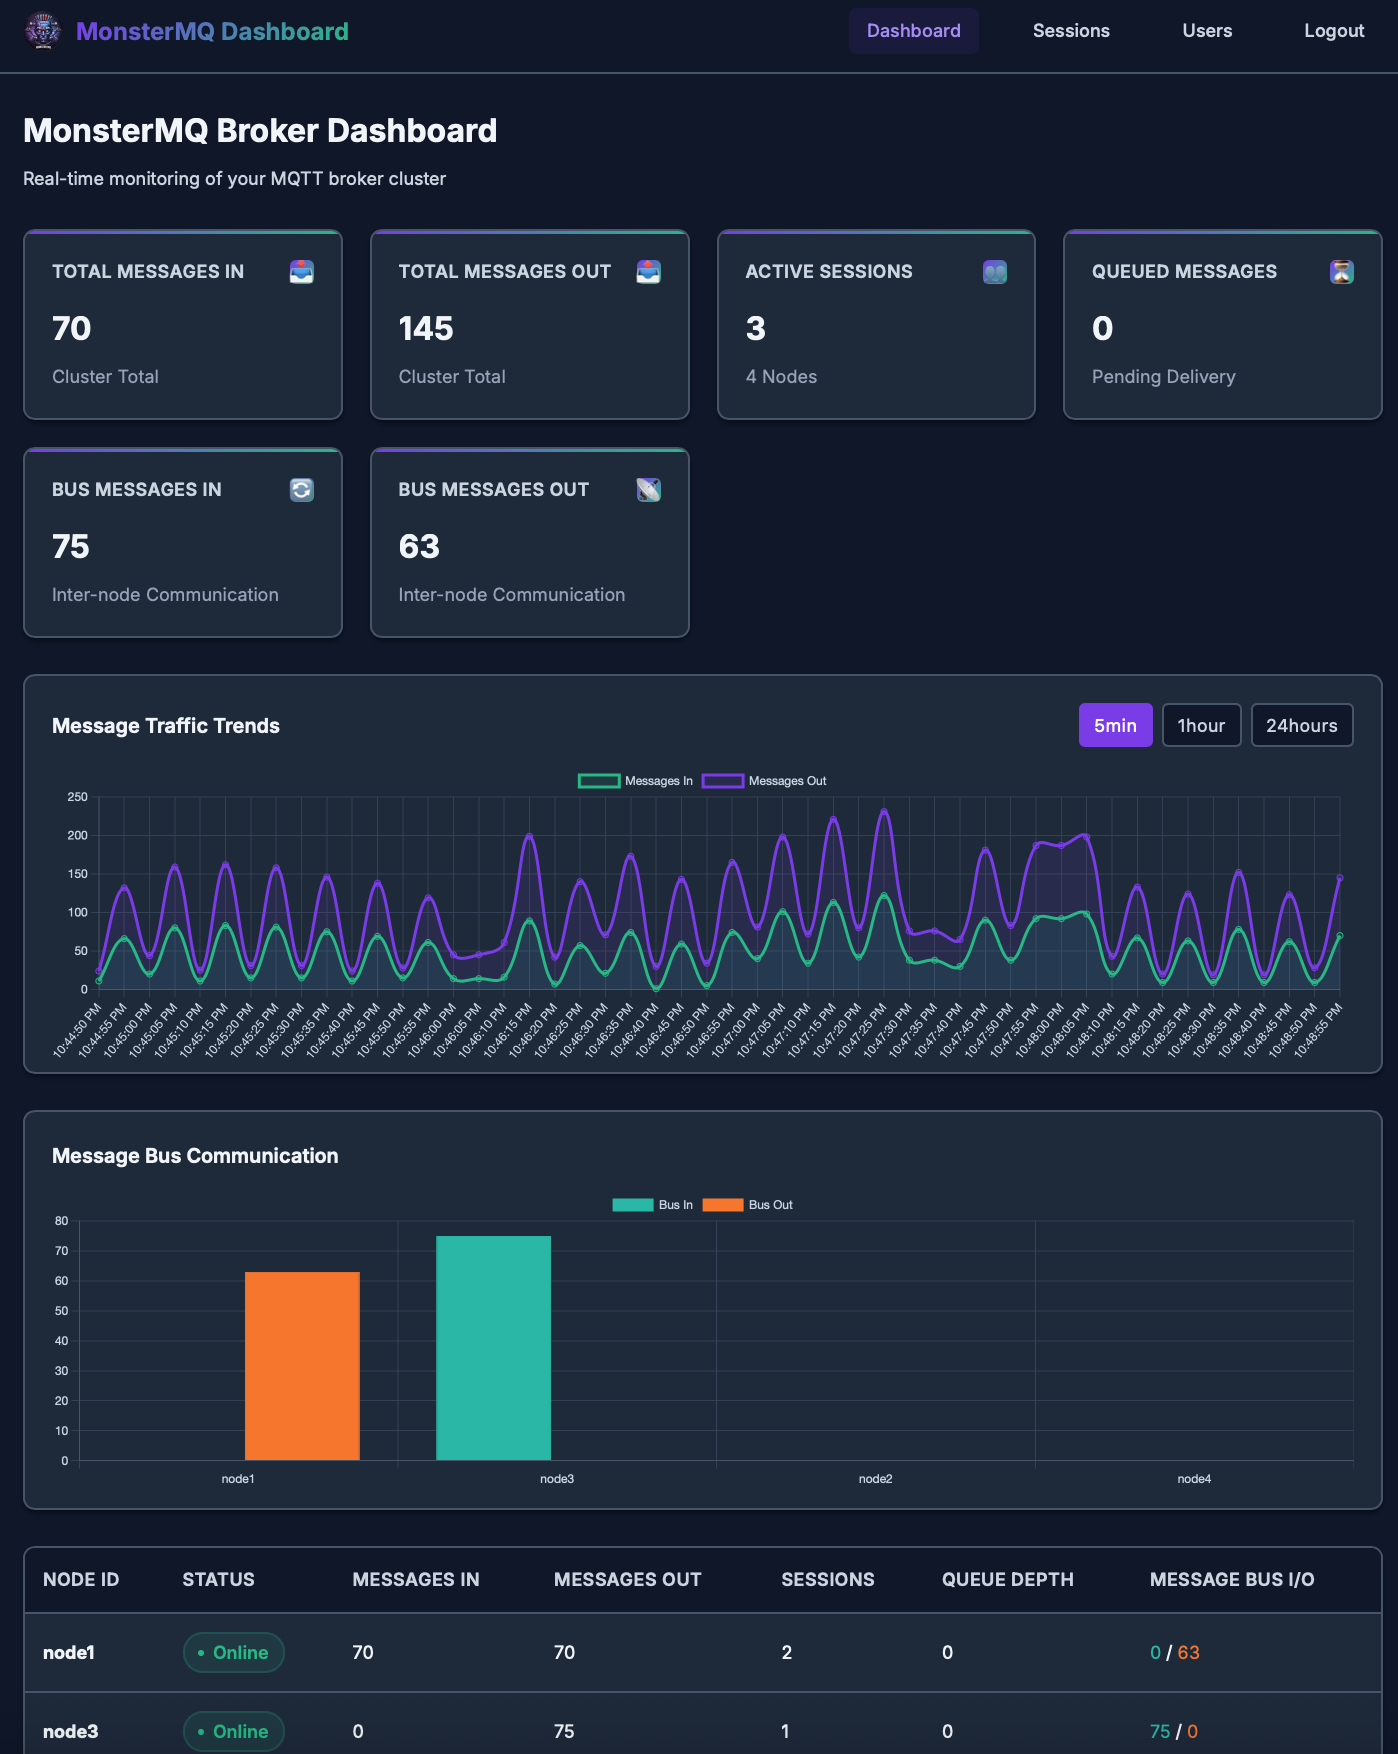
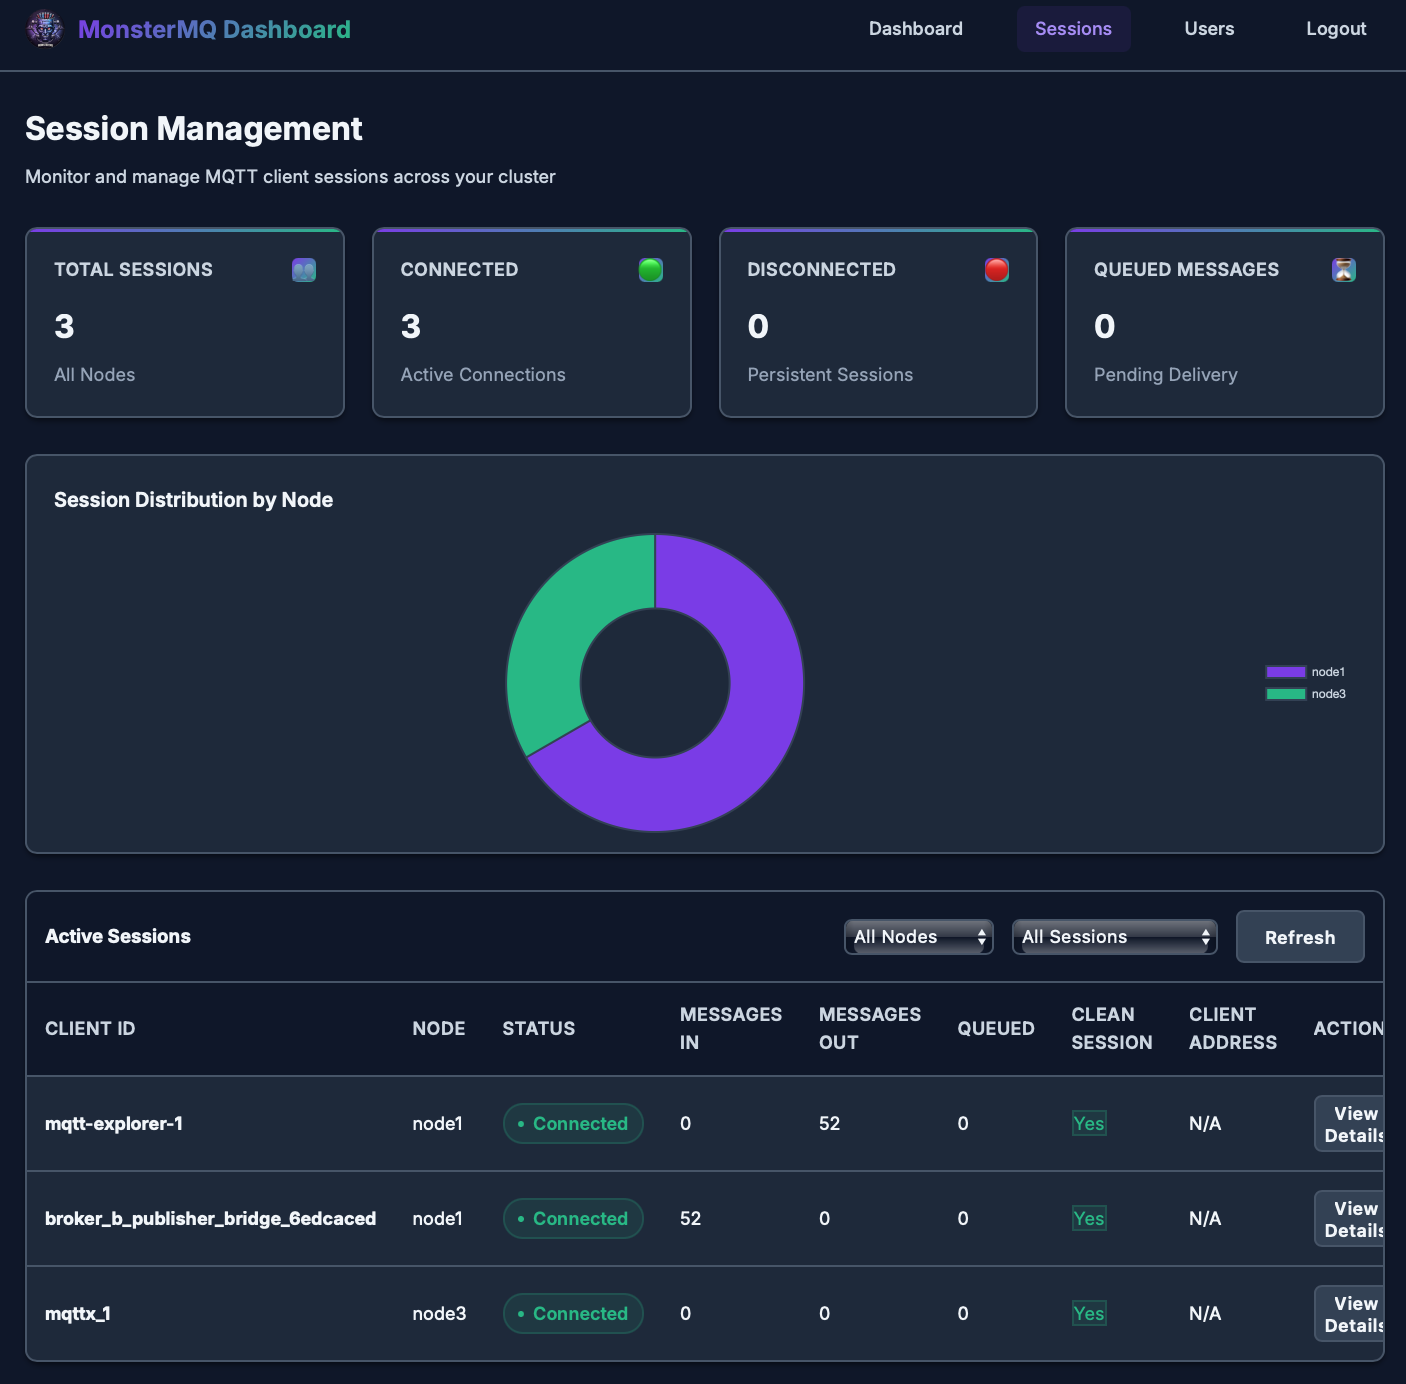
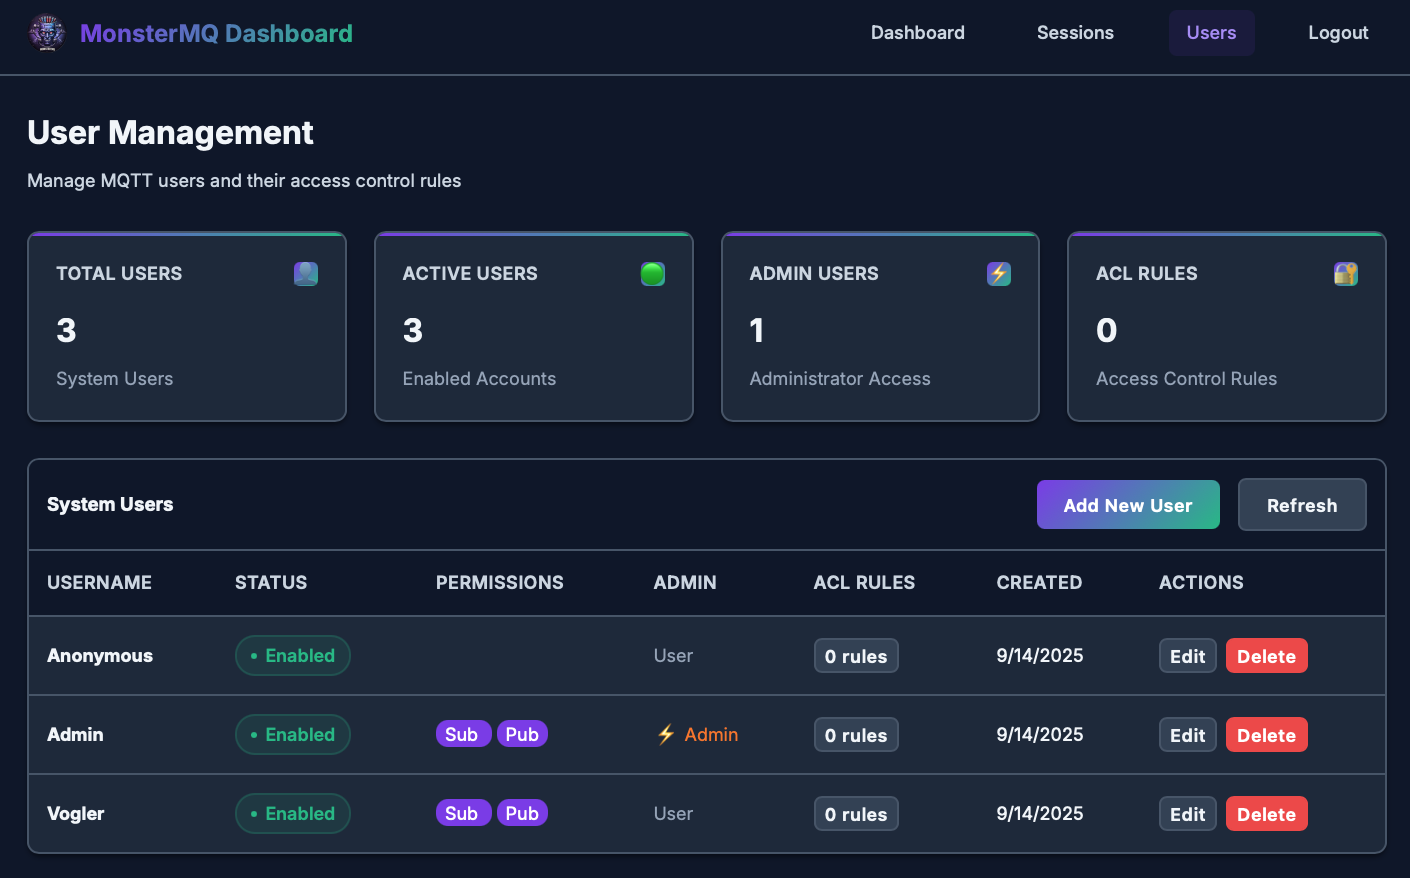
🧌 The Monster got a face: Dashboard for MonsterMQ
From the new dashboard pages, you can now:
👉 Monitor node & cluster activity
👉 Monitor connected sessions
👉 Manage users and ACLs
There is also a new homepage for MonsterMQ
👉 https://monstermq.com
The dashboard is powered by MonsterMQ Broker’s GraphQL API.
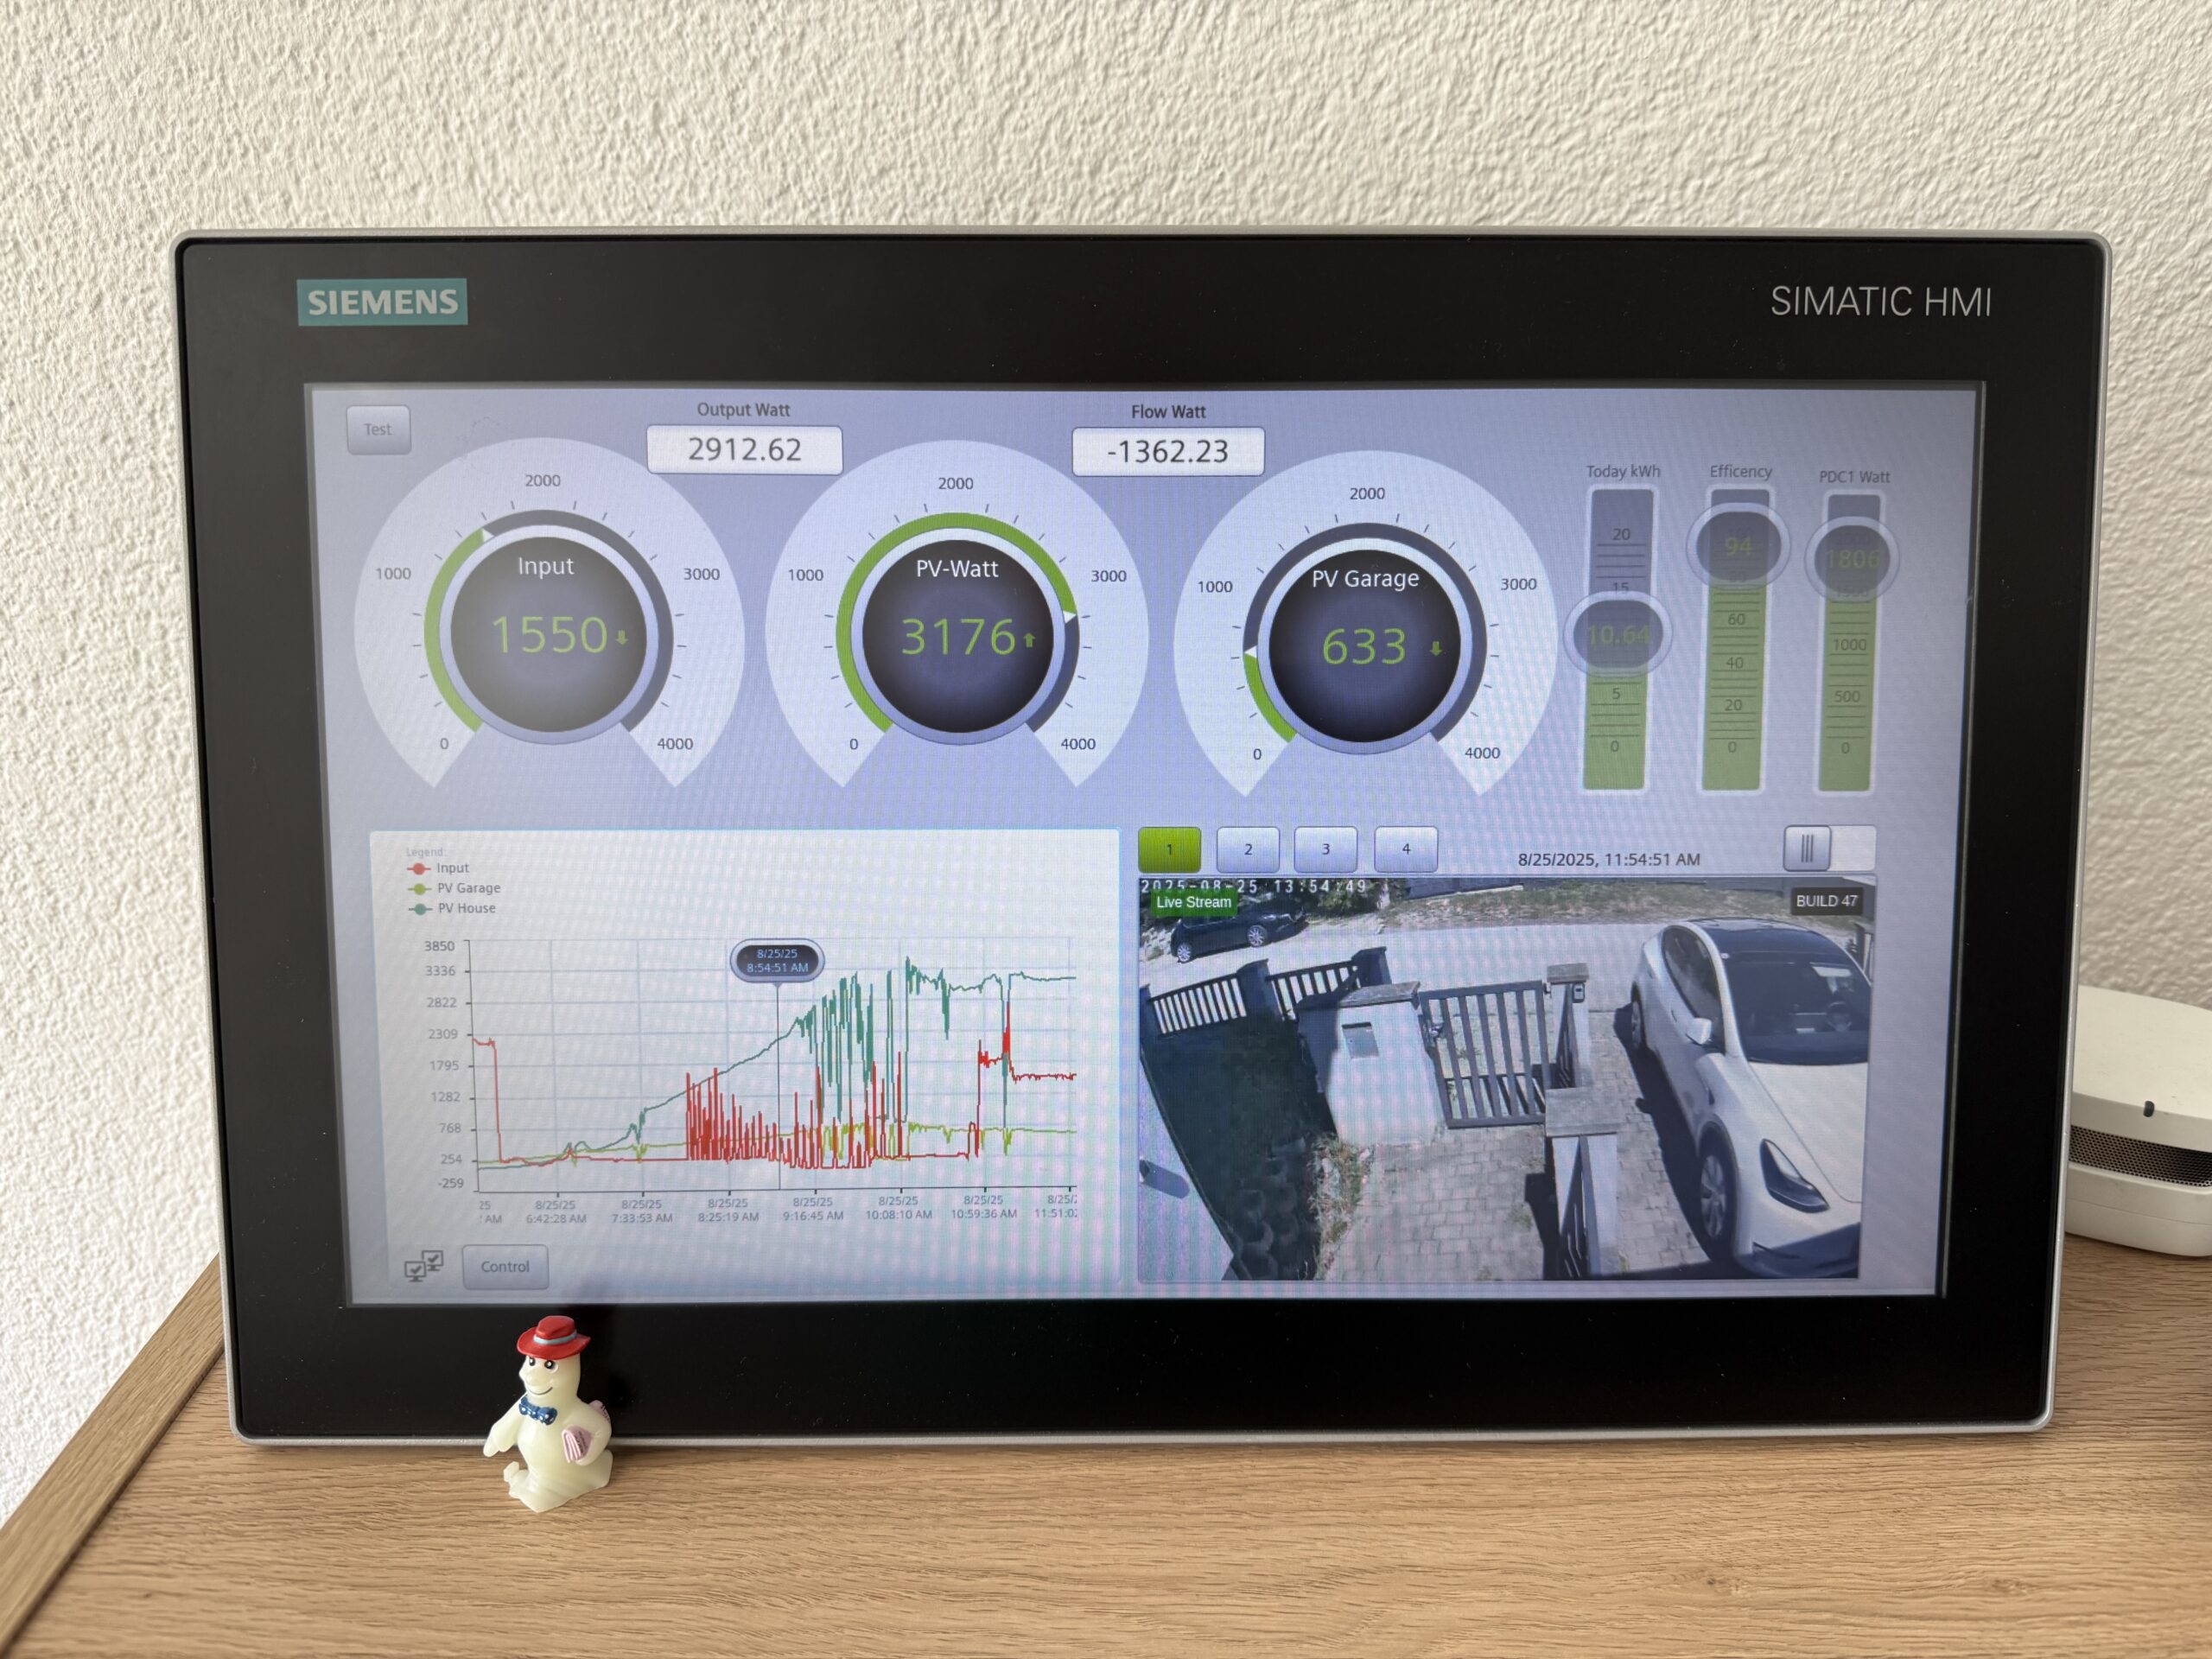
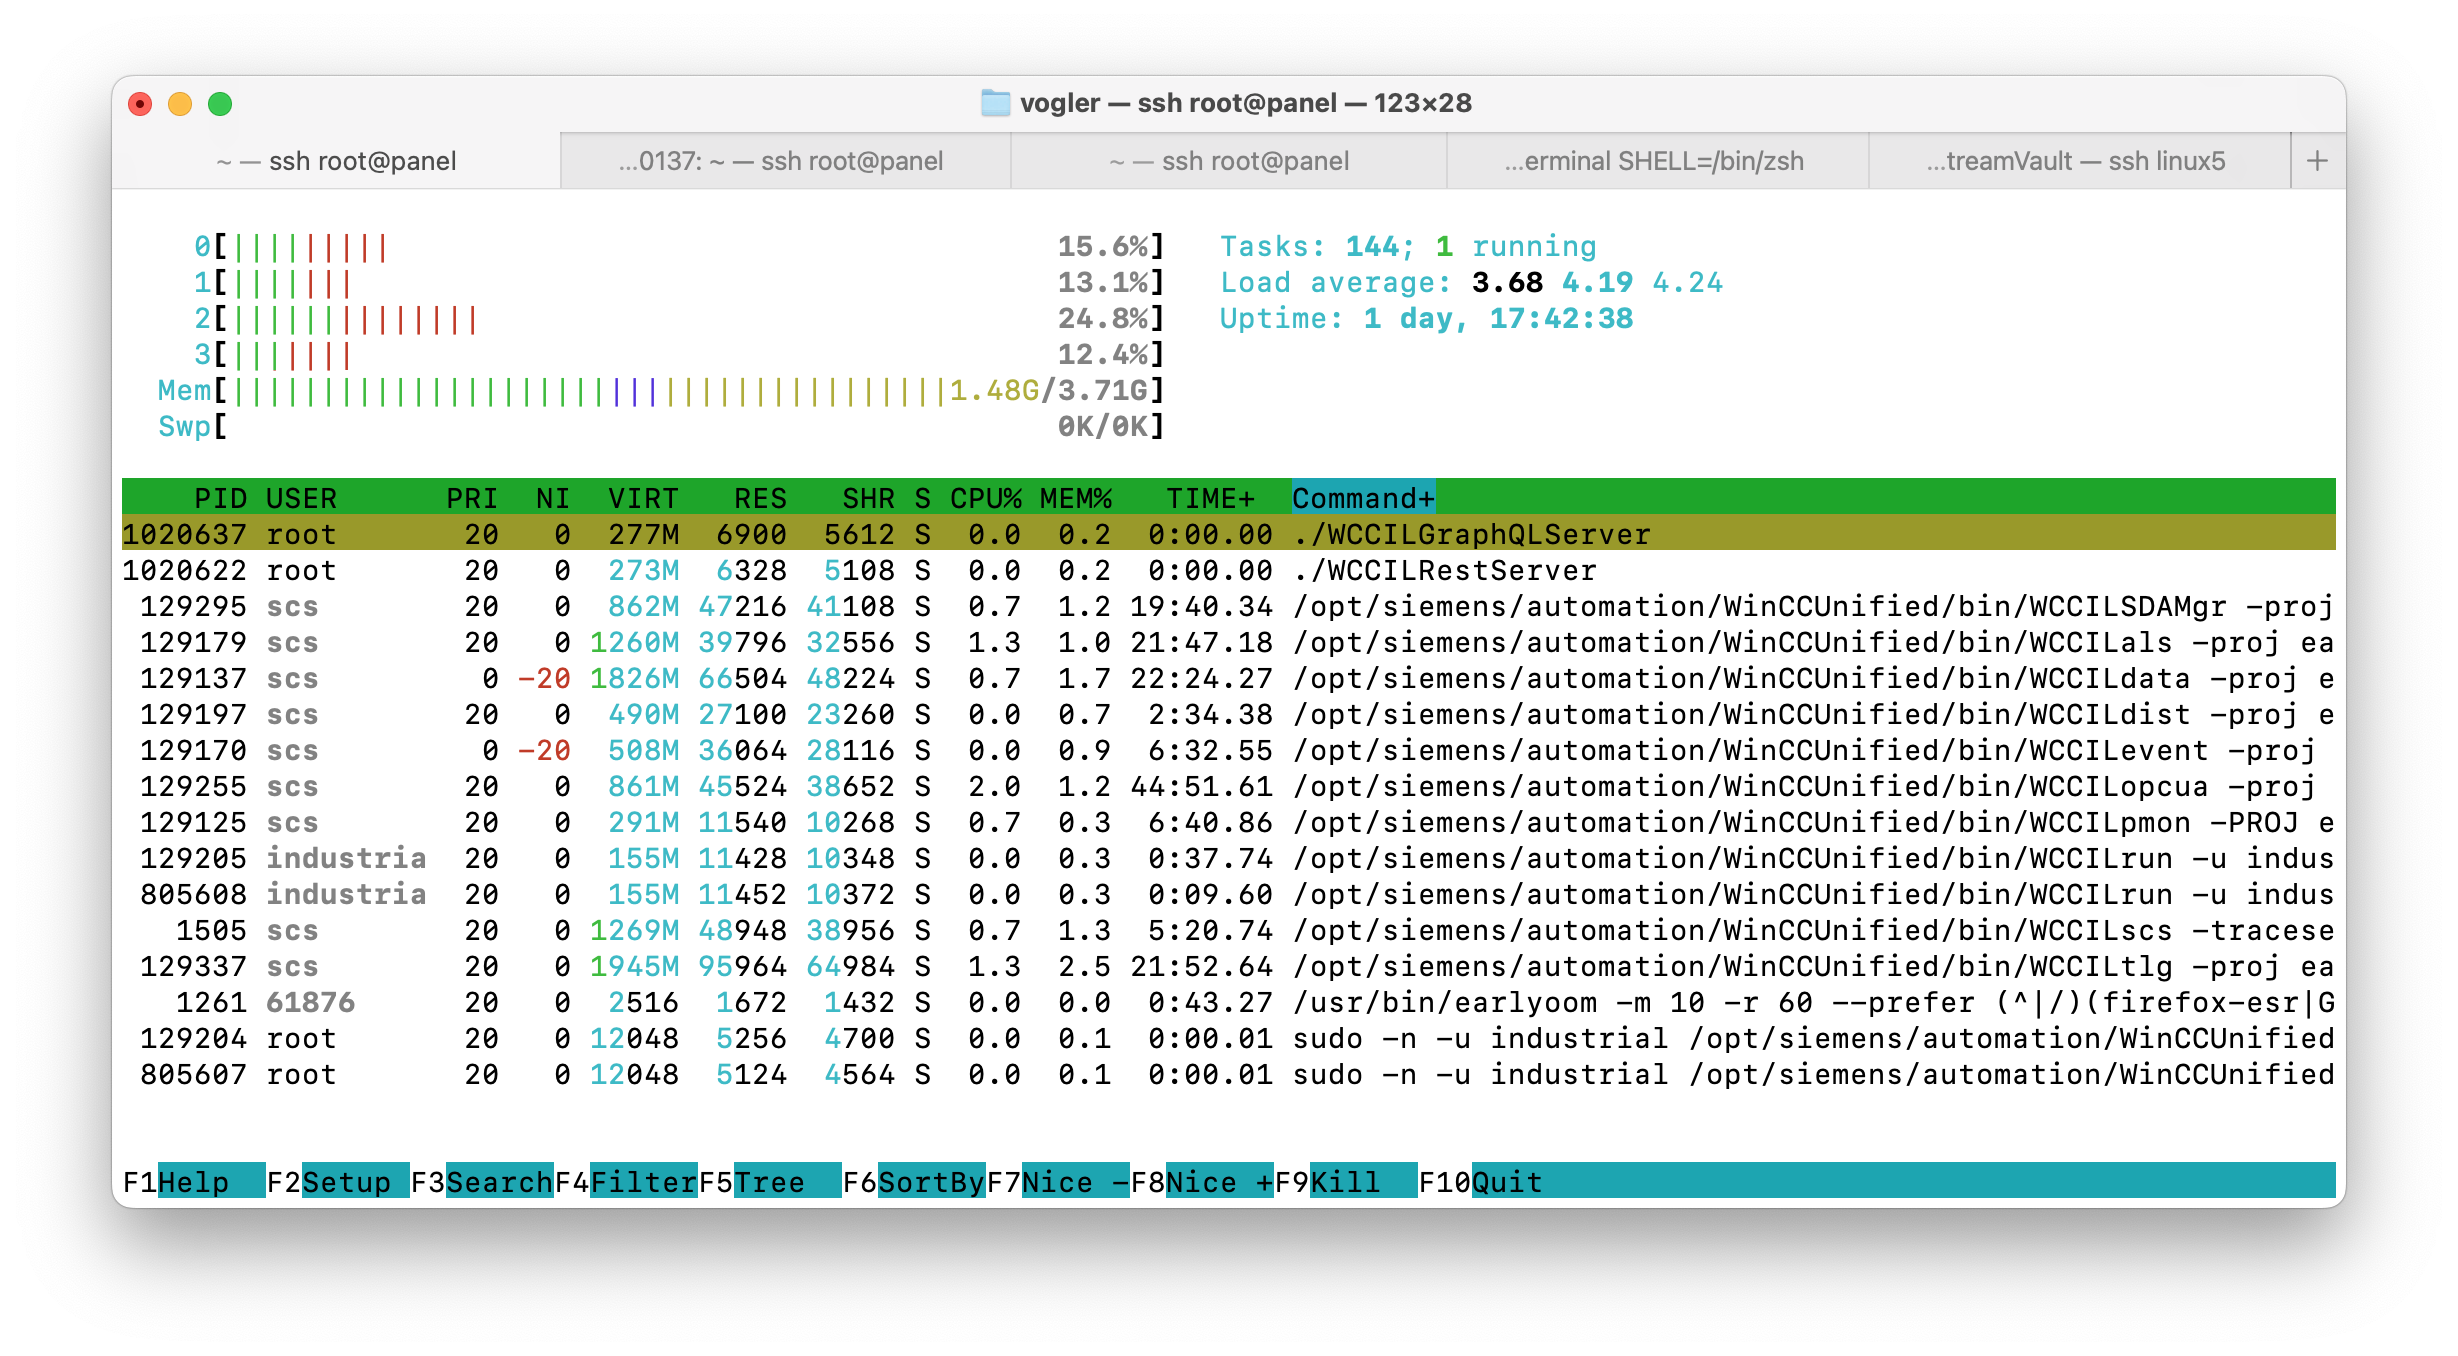
✨ Having a REST and GraphQL API on the WinCC Unified Comfort Panel — it’s possible!
I recently started using my panel at home and felt lost without having such API’s.
So I decided to change that:
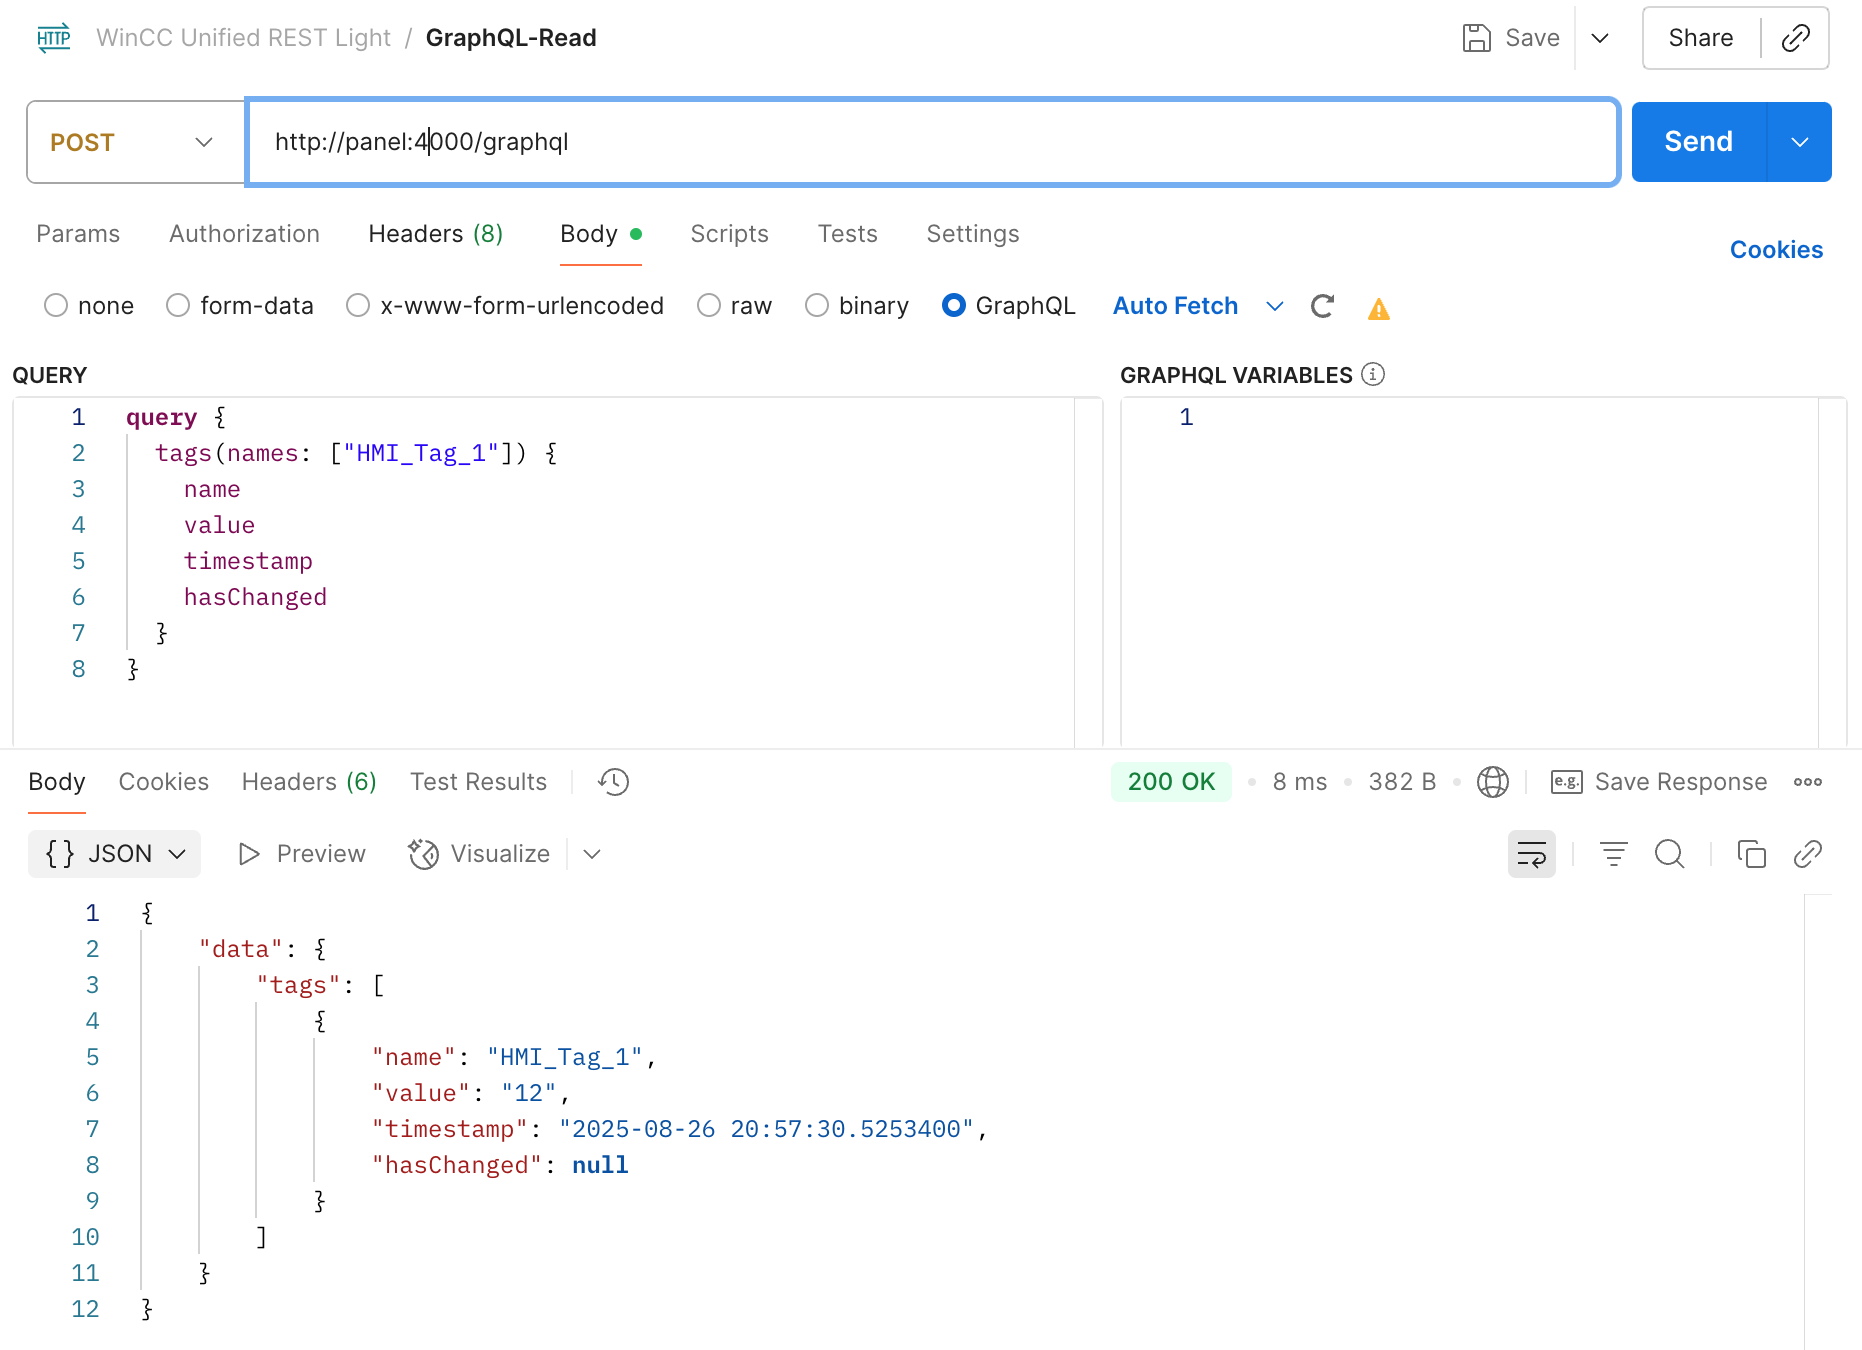
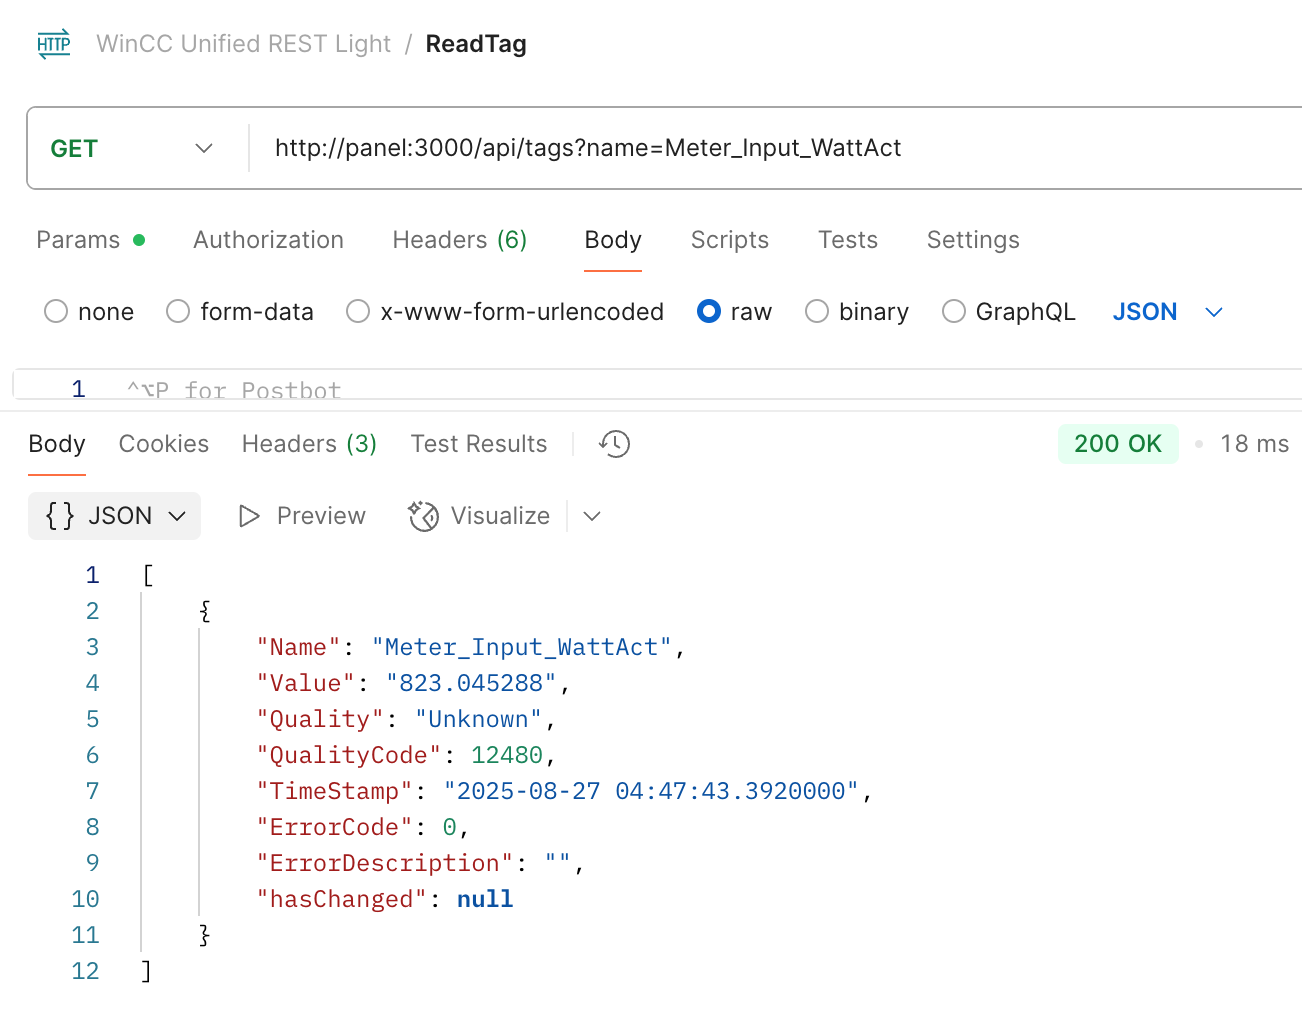
✅ I built a lightweight REST and a GraphQL server for WinCC Unified.
✅ Implemented in Rust, they’re native, lightweight, single executables.
✅ Low memory and CPU footprint – thanks to Rust!
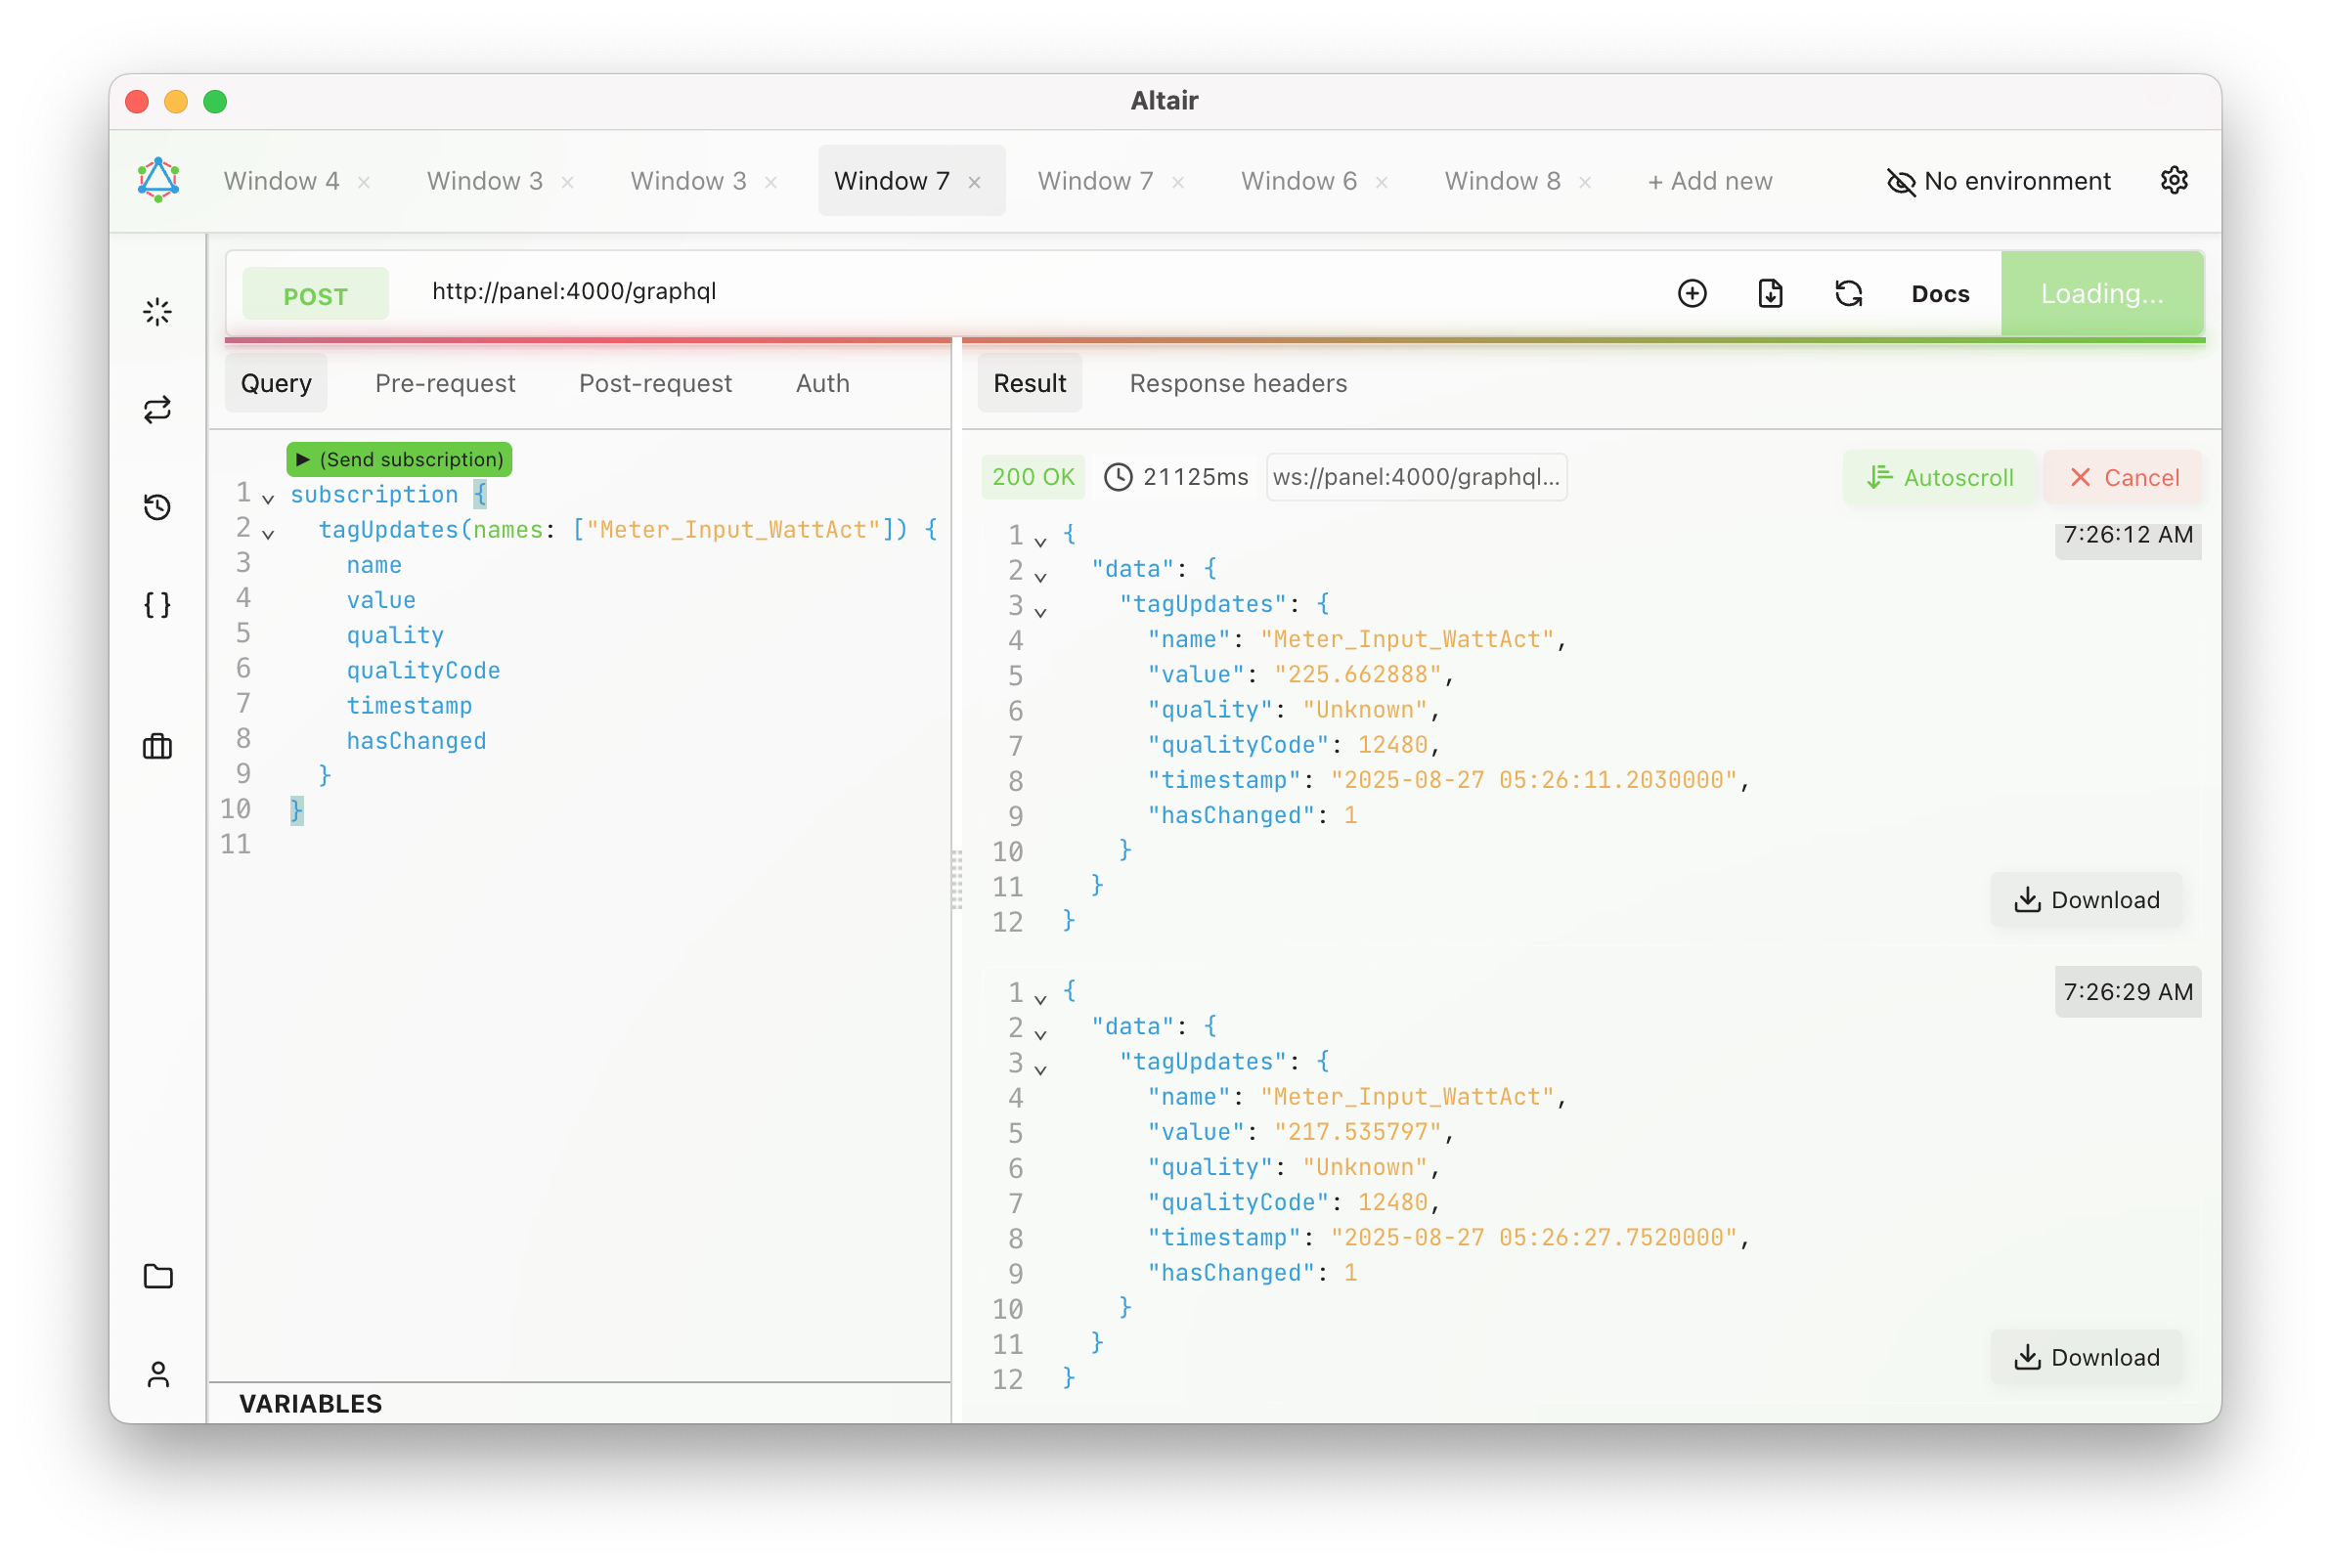
✅ With GraphQL, there is also support for tag & alarm subscriptions! 🔄
I always prefer using GraphQL — I find it tedious to constantly refer to separate REST documentation. But for some simple use cases, REST is perfectly fine.