Tag Archives: OPCUA

Publish OPC UA and MQTT Data to the Cloud with Automation-Gateway

Publish OPC UA and MQTT Data to the Cloud with Automation-Gateway – inspired by a users request 💡

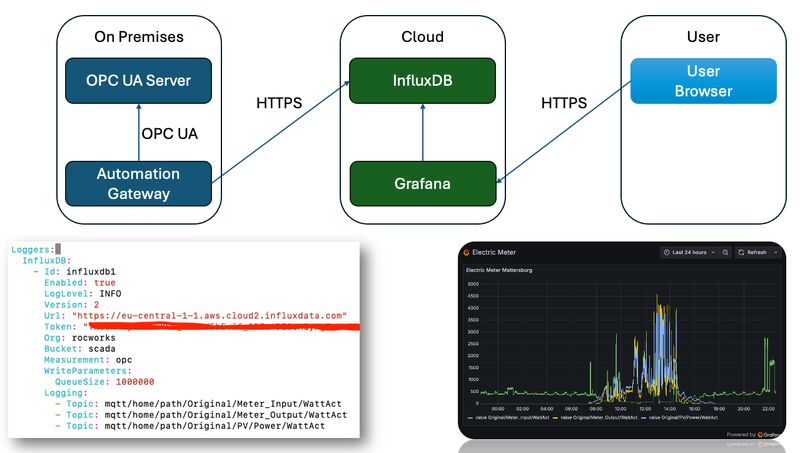
If you have a local 𝗢𝗣𝗖 𝗨𝗔 server or 𝗠𝗤𝗧𝗧 broker and want to bring that data to a 𝗰𝗹𝗼𝘂𝗱-𝗯𝗮𝘀𝗲𝗱 dashboard, Automation-Gateway.com makes it simple. You can easily publish your data to 𝗜𝗻𝗳𝗹𝘂𝘅𝗗𝗕 Cloud and visualize it in 𝗚𝗿𝗮𝗳𝗮𝗻𝗮 — all without complex setups.

I recently added support for InfluxDB V2 to the gateway, allowing you to configure an Influx token and bucket for data publishing. With just a few steps, your local OPC UA or MQTT data can be 𝘀𝘁𝗼𝗿𝗲𝗱 𝗶𝗻 𝘁𝗵𝗲 𝗰𝗹𝗼𝘂𝗱 and displayed in Grafana in real time.

Bringing PLC values to OPC UA, MQTT, GraphQL

With just some lines of configuration you can bring PLC values to OPC UA, MQTT and GraphQL. And to a variety of databases for tag logging…

💡 In that example with ModBus, but thanks to #plc4x this should work in the same way also for the other protocols supported by PLC4X.

📺 See the video, ModBus values are brought to OPC UA and MQTT.

💣 In MQTT the topic name is enriched with a UNS ISA95 topic path.

⚡ On MQTT SparkplugB encoded messages could be used.

😎 100% GUI free and Open Source.

👉 automation-gateway.com

Servers:
  GraphQL:
    - Port: 4000
      LogLevel: INFO
      GraphiQL: true

  OpcUa:
    - Port: 4841
      Enabled: true
      LogLevel: INFO      
      Topics:
        - Topic: plc/demo/node/holding-register:1:INT
        - Topic: plc/demo/node/holding-register:2:INT
        - Topic: plc/demo/node/holding-register:3:INT
Drivers:
  Plc4x:
    - Id: "demo"
      Enabled: true
      Url: "modbus://localhost:502"
      Polling:
        Time: 100
        OldNew: true
      WriteTimeout: 100
      ReadTimeout: 100
      LogLevel: INFO    

Loggers:
  Mqtt:
    - Id: mqtt1
      Enabled: true
      Host: 192.168.1.4
      Port: 1883
      Topic: modbus
      Format: Raw
      Logging:
        - Topic: plc/demo/node/holding-register:1:INT
          Target: enterprise/area1/line1/cell1/speed
        - Topic: plc/demo/node/holding-register:2:INT
          Target: enterprise/area1/line1/cell1/power
        - Topic: plc/demo/node/holding-register:3:INT
          Target: enterprise/area1/line1/cell1/torque

Automation Gateway Video Tutorial

In this tutorial, I will guide you through the essential steps to set up the Automation Gateway, harness the power of YAML extensions in Visual Studio Code for configuration, and connect various devices, including OPC UA, MQTT, and PLC4X devices. I will show how to integrate the values from the devices to the Gateway’s OPC UA server and how to use the MQTT interface to get the values from the devices via a MQTT client. Additionally values from the connected devices will be logged to a Influx database.

  • Setup 0:00 – 5:30
  • YAML-Extension 2:31 – 4:15
  • OPC UA Driver: 5:31 – 10:25
  • MQTT Interface: 10:25 – 13:40
  • MQTT Driver: 13:40 – 16:42
  • PLC4X Driver: 16:42 -19:53
  • Database Logger: 19:54 – 24:56
Setup 0:00 – 5:30
YAML-Extension 2:31 – 4:15
OPC UA Driver: 5:31 – 10:25
MQTT Interface: 10:25 – 13:40
MQTT Driver: 13:40 – 16:42
PLC4X Driver: 16:42 -19:53
Database Logger: 19:54 – 24:56

Industrial Data in the Graph Database Neo4j…

The Frankenstein Automation Gateway now also supports to write OPC UA values to the graph database Neo4j.

At startup it can also write the OPC UA node structure into the graph database, so that the basic model of the OPC UA server is mirrored to the graph database. For that you have to add the “Schemas” section in the config file (see an example configuration file below). There you can choose which RootNodes (and all sub nodes) of your OPC UA systems should be mirrored to the graph database.

Once you have the (simplified) OPC UA information model in the graph database, you can add on top of that your own knowledge graph data and create relations to OPC UA nodes of your machines to enrich the semantic data of the OPC UA model.

With that model you can leverage the power of your Knowledge Graphs in combination with live data from your machines and use Cypher queries to get the knowledge out of the graph.

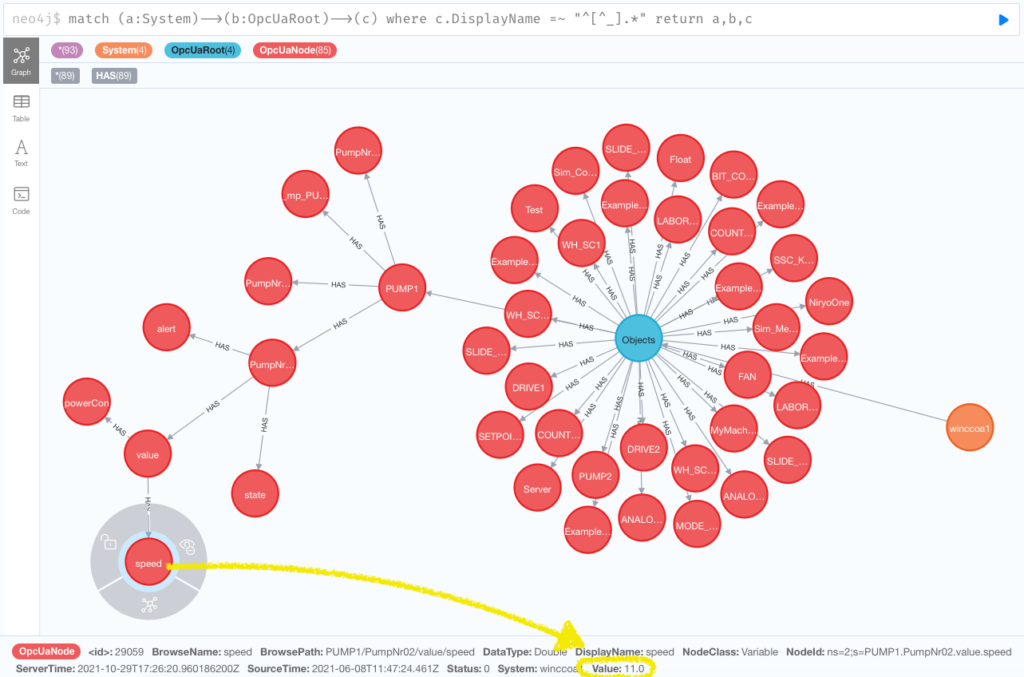
Here we see an example of the OPC UA server from the SCADA System WinCC Open Architecture. The first level of nodes below the “Objects” node represent Datapoint-Types (e.g. PUMP1) followed by the Datapoint-Instances (e.g.: PumpNr) and below that we see the datapoint elements (e.g. value => speed). An datapoint element is an OPC UA variable where we also see the current value from the SCADA system.

Example Gateway configuration file:

Database:
  Logger:
    - Id: neo4j
      Enabled: true
      Type: Neo4j
      Url: bolt://nuc1.rocworks.local:7687
      Username: "neo4j"
      Password: "manager"
      Schemas:
        - System: opc1  # Replicate node structure to the graph database
          RootNodes:
            - "ns=2;s=Demo"  # This node and everything below this node
        - System: winccoa1  # Replicate the nodes starting from "i=85" (Objects) node
      WriteParameters:
        BlockSize: 1000
      Logging:
        - Topic: opc/opc1/path/Objects/Demo/SimulationMass/SimulationMass_Float/+
        - Topic: opc/opc1/path/Objects/Demo/SimulationMass/SimulationMass_Double/+
        - Topic: opc/opc1/path/Objects/Demo/SimulationMass/SimulationMass_Int16/+
        - Topic: opc/winccoa1/path/Objects/PUMP1/#
        - Topic: opc/winccoa1/path/Objects/ExampleDP_Int/#


How to log OPC UA tag values to Apache Kafka…

In this article we use the Frankenstein Automation Gateway to subscribe to one public available OPC UA server (milo.digitalpetri.com) and log tag values to Apache Kafka. Additionally we show how you can create a Stream in Apache Kafka based on the OPC UA values coming from the milo OPC UA server and query those stream with KSQL.

Setup Apache Kafka

We have used the all-in-one Docker compose file from confluent to quickly setup Apache Kafka and KSQL. Be sure that you set your resolvable hostname or IP address of your server in the docker-compose.yml file. Otherwise Kafka clients cannot connect to the broker.

KAFKA_ADVERTISED_LISTENERS: PLAINTEXT://broker:29092,PLAINTEXT_HOST://192.168.1.18:9092

Setup Frankenstein

Install Java 11 (for example Amazon Corretto) and Gradle for Frankenstein. Unzip Gradle to a folder and set your PATH variable to point to the bin directory of Gradle.

Then clone the source of Frankenstein and compile it with Gradle:

git clone https://github.com/vogler75/automation-gateway.git
cd automation-gateway/source/app
gradle build

There is a example config-milo-kafka.yaml file in the automation-gateway/source/app directory which you can use by setting the environment variable GATEWAY_CONFIG.

export GATEWAY_CONFIG=config-milo-kafka.yaml

In this config file we use a public Eclipse Milo OPC UA server. The Id of this connection is “milo“.

OpcUaClient:
  - Id: "milo"
    Enabled: true
    LogLevel: INFO
    EndpointUrl: "opc.tcp://milo.digitalpetri.com:62541/milo"
    UpdateEndpointUrl: false
    SecurityPolicyUri: http://opcfoundation.org/UA/SecurityPolicy#None
    UsernameProvider:
      Username: user1
      Password: password

Here is the configuration of the Kafka Logger where you can configure what OPC UA tags should be published to Kafka. In that case we use a OPC UA Browse Path and a wildcard to use all variables below one node.

Database:
  Logger:
    - Id: kafka1
      Type: Kafka
      Enabled: true
      Servers: server2:9092
      WriteParameters:
        QueueSize: 20000
        BlockSize: 10000
      Logging:
        - Topic: opc/milo/path/Objects/Dynamic/+

Start Frankenstein

export GATEWAY_CONFIG=config-milo-kafka.yaml
gradle run

Create a Stream in KSQL

Start a CLI session to KSQL on the host where the Kafka containers run:

docker exec -ti ksqldb-cli ksql http://ksqldb-server:8088

Create a stream for the Kafka “milo” topic

CREATE STREAM milo(
  browsePath VARCHAR KEY, 
  sourceTime VARCHAR, 
  value DOUBLE, 
  statusCode VARCHAR
) WITH (
  KEY_FORMAT='KAFKA',
  KAFKA_TOPIC='milo', 
  VALUE_FORMAT='JSON',
  TIMESTAMP='sourceTime',TIMESTAMP_FORMAT='yyyy-MM-dd''T''HH:mm:ss.nX'
);

Then you can execute a KSQL query to get the stream of values from the OPC UA server:

ksql> select browsepath, sourcetime, value from milo emit changes;
+---------------------------------------+---------------------------------------+---------------------------------------+
|BROWSEPATH                             |SOURCETIME                             |VALUE                                  |
+---------------------------------------+---------------------------------------+---------------------------------------+
|Objects/Dynamic/RandomInt32            |2021-05-02T11:29:04.405465Z            |1489592303                             |
|Objects/Dynamic/RandomInt64            |2021-05-02T11:29:04.405322Z            |-6.3980451035323023E+18                |
|Objects/Dynamic/RandomFloat            |2021-05-02T11:29:04.405350Z            |0.7255345                              |
|Objects/Dynamic/RandomDouble           |2021-05-02T11:29:04.405315Z            |0.23769088795602633                    |
Automation Gateway with Apache IoTDB…

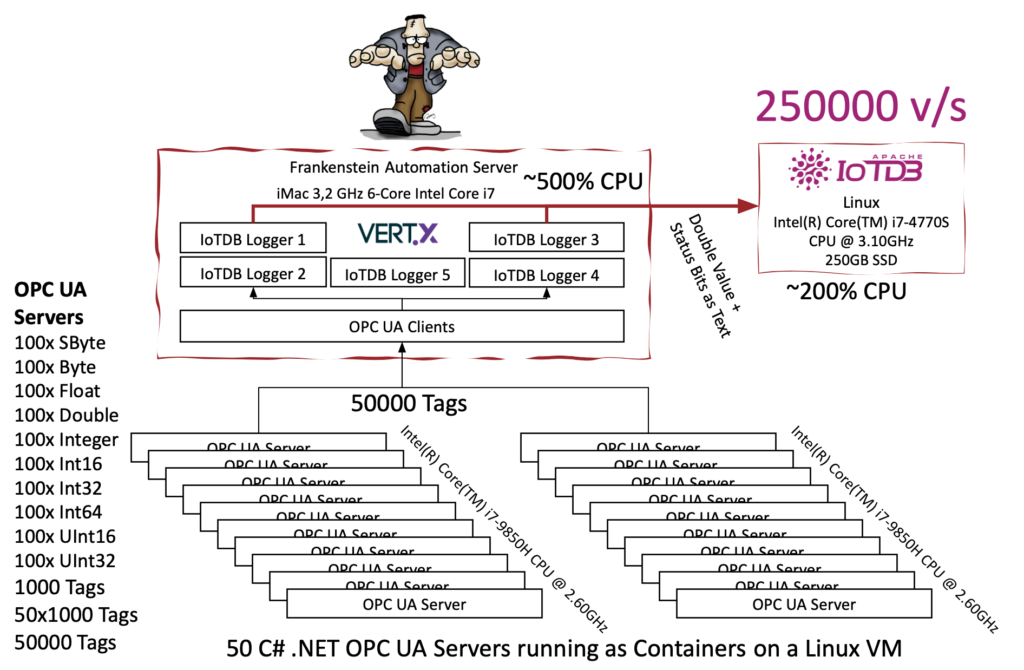
The Frankenstein Automation Gateway can now write OPC UA tag values to the Apache IoTDB. Did some rough performance tests with 50 OPC UA servers and one IoTDB… the IoTDB is pretty impressive fast. Also the data model and terminology is interesting and it seems to fit good to a hirarchical structure in OPC UA.

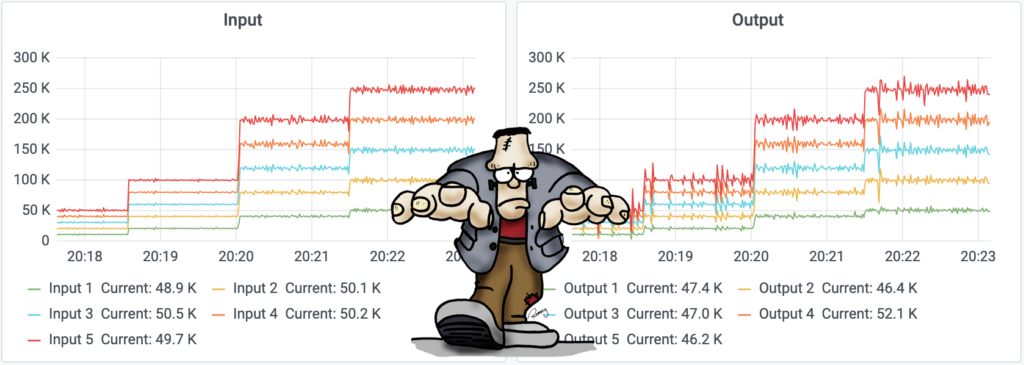
In this lab I have connected 50 OPC UA servers (based on a .NET OPC UA server example) to Frankenstein. Each OPC UA server publishes 1000 tags of different type, so in summary we have 50000 tags connected to Frankenstein. The publish rate can be adjusted by setting an OPC UA tag. Sure, we do that via GraphQL over Frankenstein. On my commodity hardware I ended with writing about 250Khz to the IoTDB with an CPU load of ~200%. So, I assume the IoTDB is able to handle much more value changes per second.

Figured out that one DB Logger inside of Frankenstein roughly is able to handle 100000 events per second. We can spawn multiple DB Logger for scalabilty. Vert.X can then use multiple cores (Vert.X calls this pattern the Multi-Reactor Pattern to distinguish it from the single threaded reactor pattern).

Just to note: there is only a memory buffer implemented, so if the DB is down, then the values will be lost if the buffer runs out of space. But I think to handle such situations it would make sense to put Apache Kafka between the Gateway and the Database.

GraphQL Query to set the simulation interval:

query ($v: String) {
  Systems {
    opc1 { Demo { SimulationInterval { SetValue(Value: $v) } } }
    opc2 { Demo { SimulationInterval { SetValue(Value: $v) } } }
    opc3 { Demo { SimulationInterval { SetValue(Value: $v) } } }
    opc4 { Demo { SimulationInterval { SetValue(Value: $v) } } }
    opc5 { Demo { SimulationInterval { SetValue(Value: $v) } } }
    opc6 { Demo { SimulationInterval { SetValue(Value: $v) } } }
    opc7 { Demo { SimulationInterval { SetValue(Value: $v) } } }
    opc8 { Demo { SimulationInterval { SetValue(Value: $v) } } }
    opc9 { Demo { SimulationInterval { SetValue(Value: $v) } } }
    ...
  }
}
Query Variables: {"v": "250"}