Welcome to a brand new episode of our tech podcast! Today, we are diving deep into the world of industrial IoT, OT-to-IT bridging, and how a revolutionary open-source project is changing the game. We are thrilled to present our episode: “MonsterMQ Collapses the Industrial Protocol Soup.”
What is MonsterMQ?
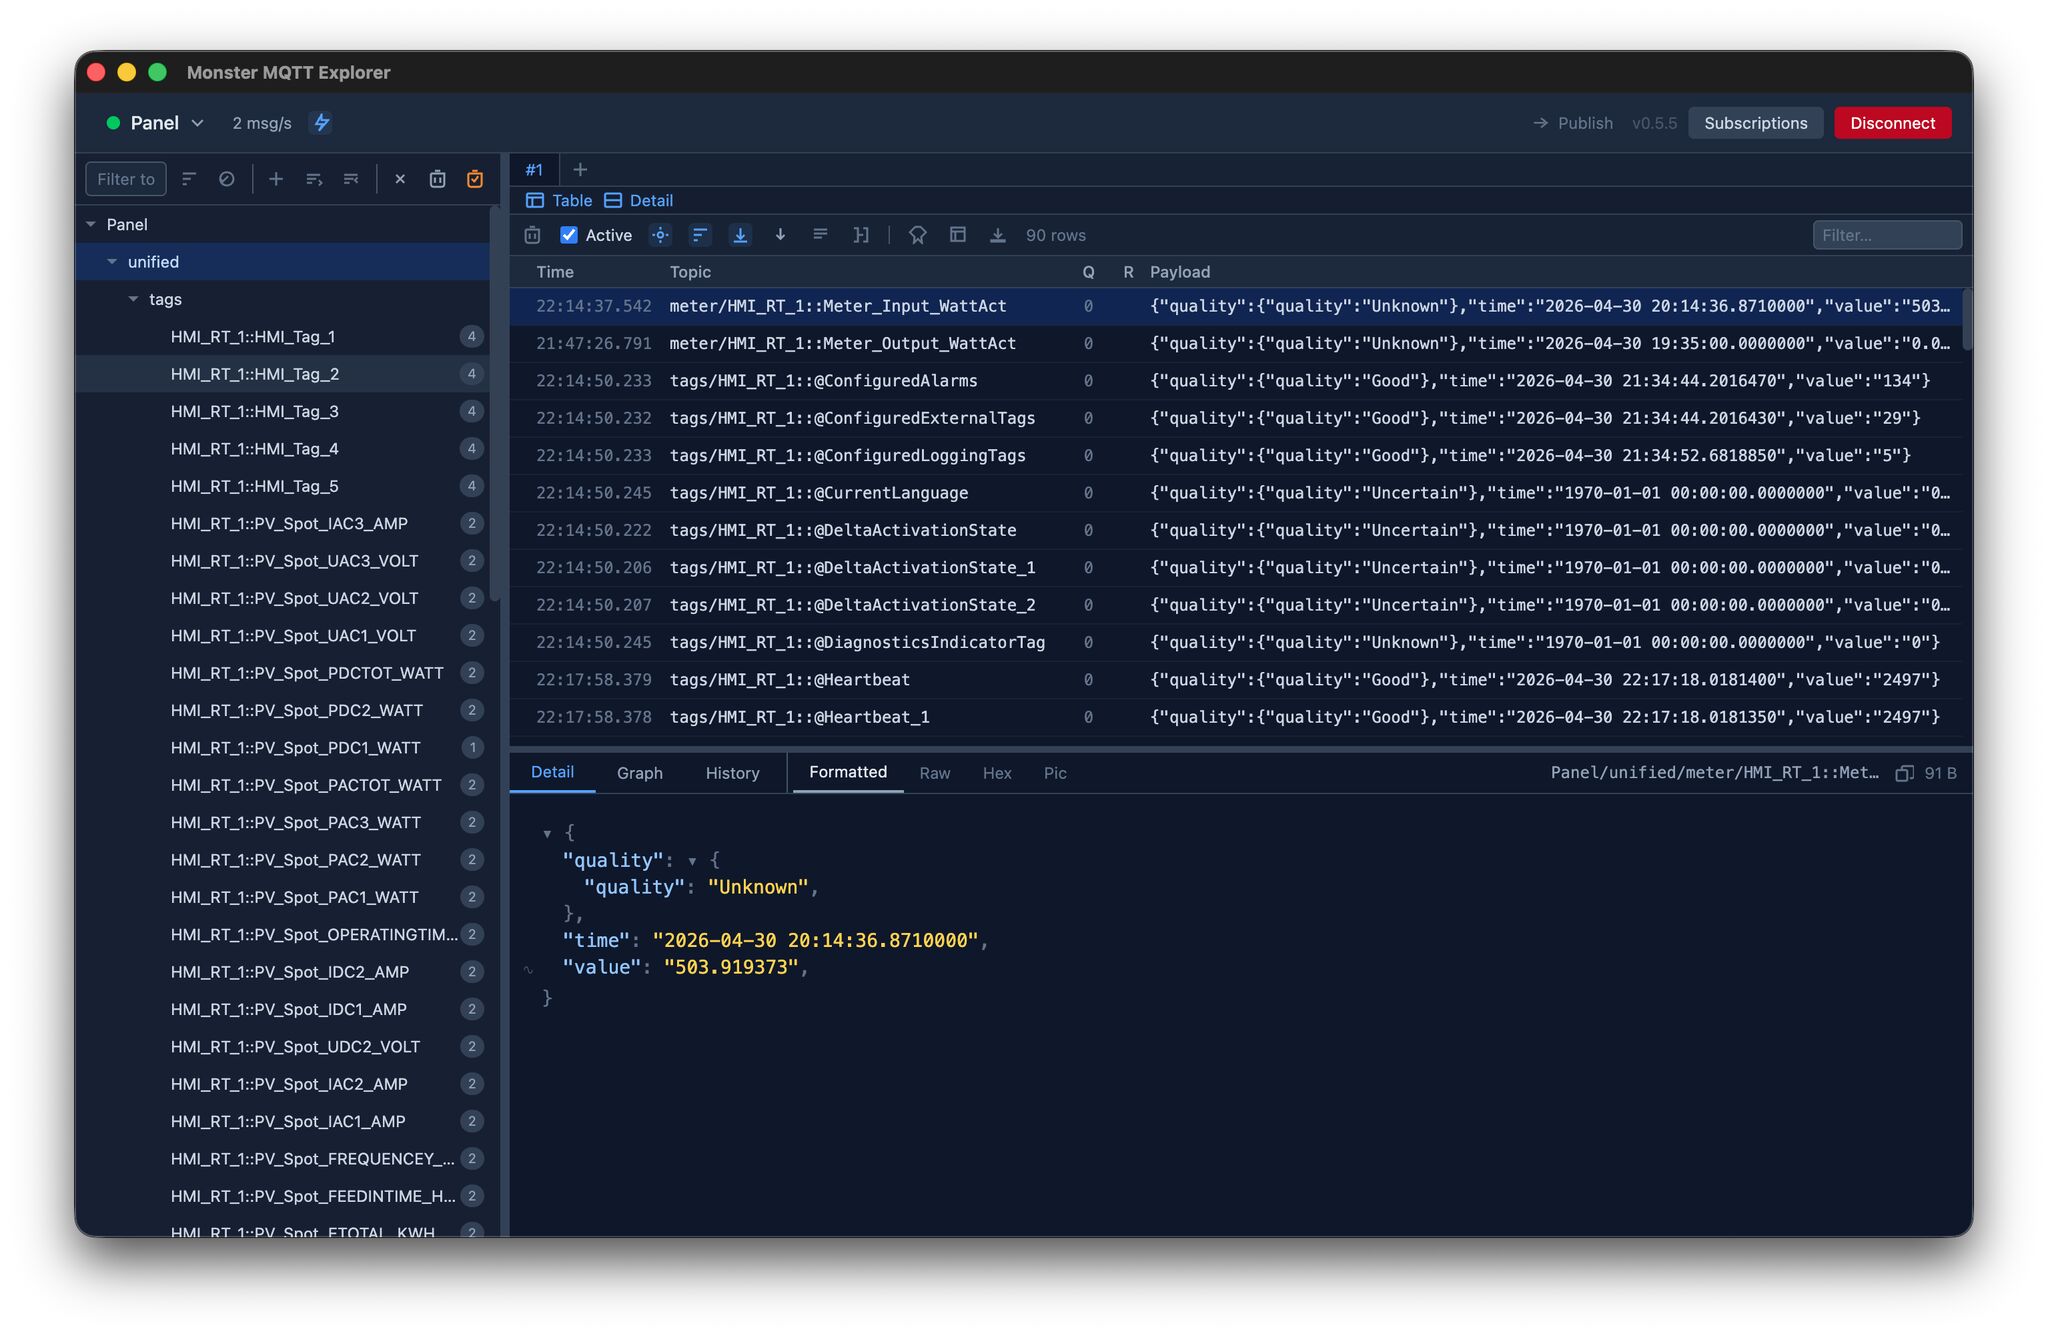
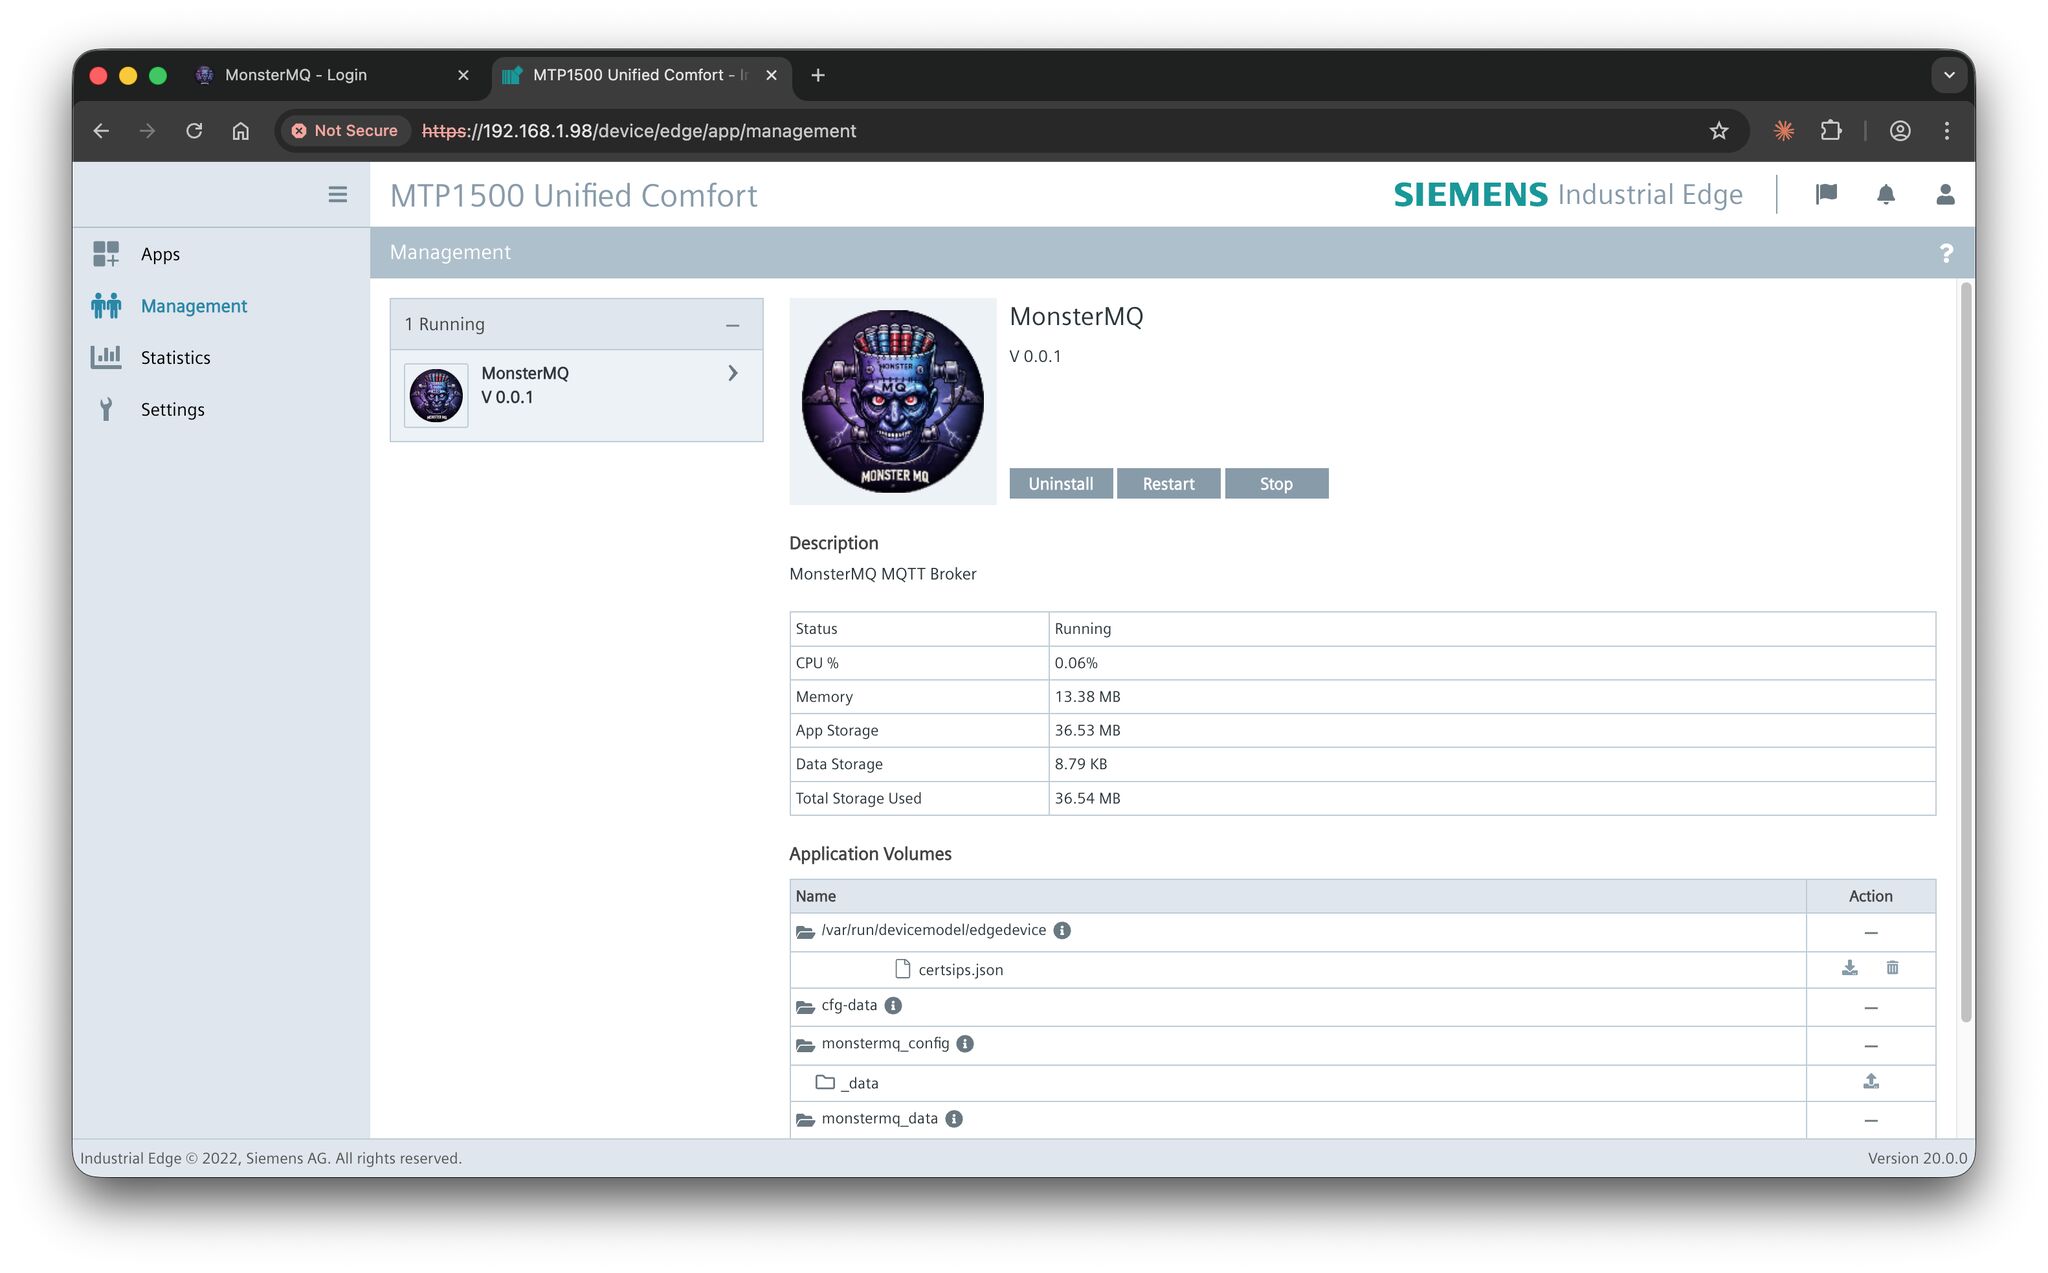
At its core, MonsterMQ is a next-generation, high-performance MQTT broker specifically designed for Industrial IoT (IIoT) and real-time enterprise messaging. Built on top of the ultra-fast Vert.x reactive runtime, MonsterMQ isn’t just another broker—it is a complete, multi-protocol edge integration engine. It blends high-speed message queuing, native database logging, visual flow-based processing, and autonomous AI agents into a single, unified runtime.
The “Industrial Protocol Soup” Challenge
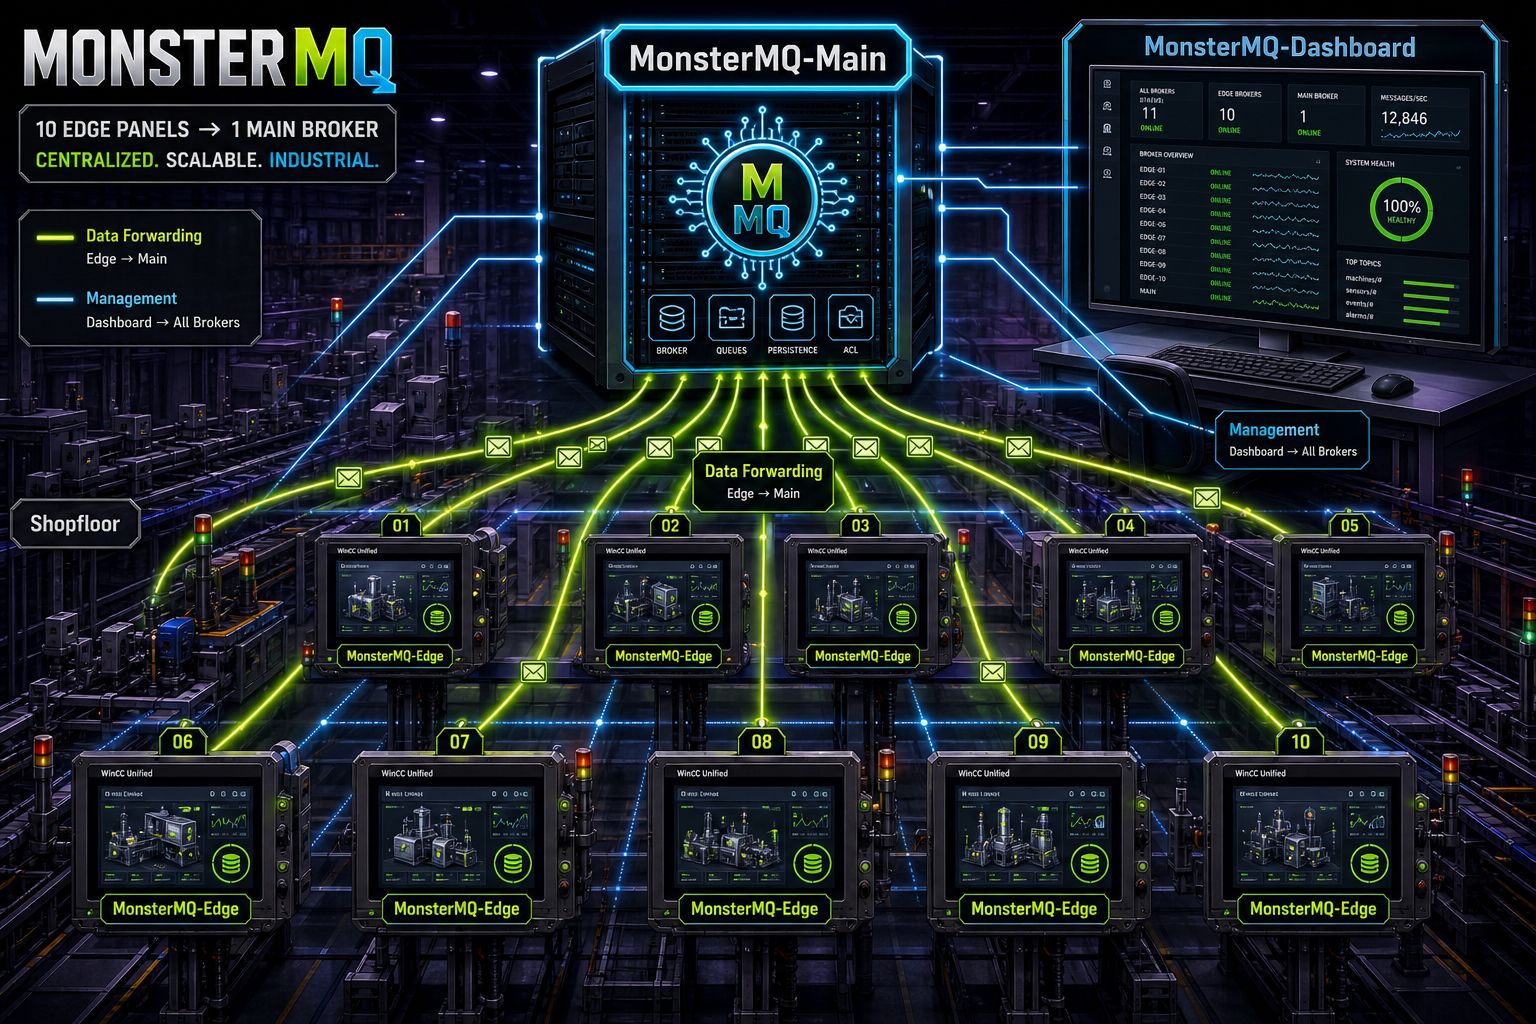
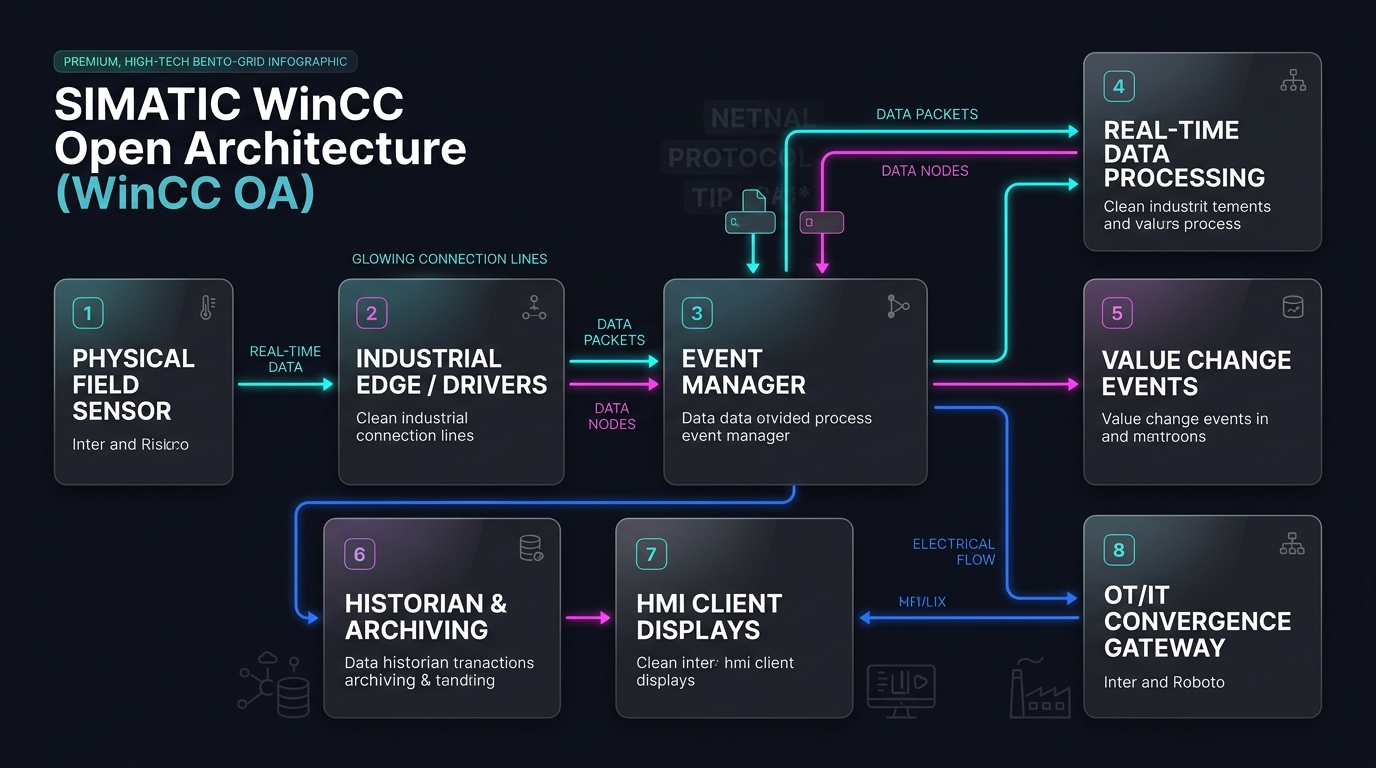
If you’ve ever worked in a modern factory or industrial environment, you know the pain. Operational Technology (OT) is a fragmented ecosystem of legacy and proprietary protocols. You have PLCs talking Siemens S7 or Modbus, SCADA systems like WinCC OA or WinCC Unified exposing internal tag engines, and other machines using OPC UA.
To get this data into IT systems, companies traditionally build complex pipelines involving multiple gateway boxes, custom translators, external MQTT brokers, database connectors, and cloud bridges. This fragmented architecture is difficult to maintain, introduces significant latency, and creates a fragile “protocol soup” that is prone to breaking.
How MonsterMQ Collapses the Soup
MonsterMQ simplifies this mess by acting as a single, consolidated platform that speaks both OT and IT languages natively. Instead of daisy-chaining middleware, MonsterMQ integrates these components directly into the broker:
- Native OT Adapters: Connects directly to OPC UA, PLC4X (S7/Modbus), WinCC OA, WinCC Unified, and even Redis or Kafka.
- Dual-Engine Core (MQTT & NATS): Supports MQTT 3.1.1/5 and native NATS protocol handling. It can route messages between MQTT and NATS clients with zero external bridges, allowing OT devices to seamlessly talk to high-speed backend microservices.
- Direct-to-Database Archiving: Logs data directly to PostgreSQL, CrateDB, MongoDB, SQLite, and Snowflake via schema-based JDBC logging. No separate database loggers required.
What Makes MonsterMQ Truly Unique?
Beyond traditional bridging, MonsterMQ introduces two groundbreaking features that set it apart from standard brokers:
1. Built-in JavaScript Flow Engine
MonsterMQ features a visual, JavaScript-based workflow and flow engine. This allows engineers to filter, transform, aggregate, and route messages on the fly using standard JavaScript directly inside the broker context. You can write custom script blocks to sanitize data before archiving or trigger webhooks when variables cross critical thresholds.
2. Autonomous Edge AI Agents
In a world-first for MQTT brokers, MonsterMQ integrates native AI agent orchestration. Supporting multiple LLM providers (including Gemini, Claude, OpenAI, and Ollama), you can configure AI agents that trigger on specific MQTT topics, run on cron schedules, or talk to other agents. This opens the door to edge-based anomaly detection, natural language querying of industrial tags, and autonomous local troubleshooting.
Key Feature Highlights
- Vert.x Architecture: Multi-threaded, non-blocking I/O event loops capable of handling millions of messages with minimal CPU and memory footprints.
- Flexible Edge Deployments: A config-based feature flag system allows you to disable heavy extensions (like AI or JDBC storage) on resource-constrained edge gateways while enabling them on cloud instances.
- Clustering & High Availability: In-memory clustering (via Hazelcast) allows horizontal scaling across multiple nodes.
- Modern APIs: Exposes a comprehensive GraphQL API, REST API (supporting InfluxDB Line Protocol ingestion), and an MCP (Model Context Protocol) server for seamless AI tool integration.
Listen to the full podcast above to hear our hosts break down the architecture, discuss real-world industrial deployments, and share their experiences building on MonsterMQ.