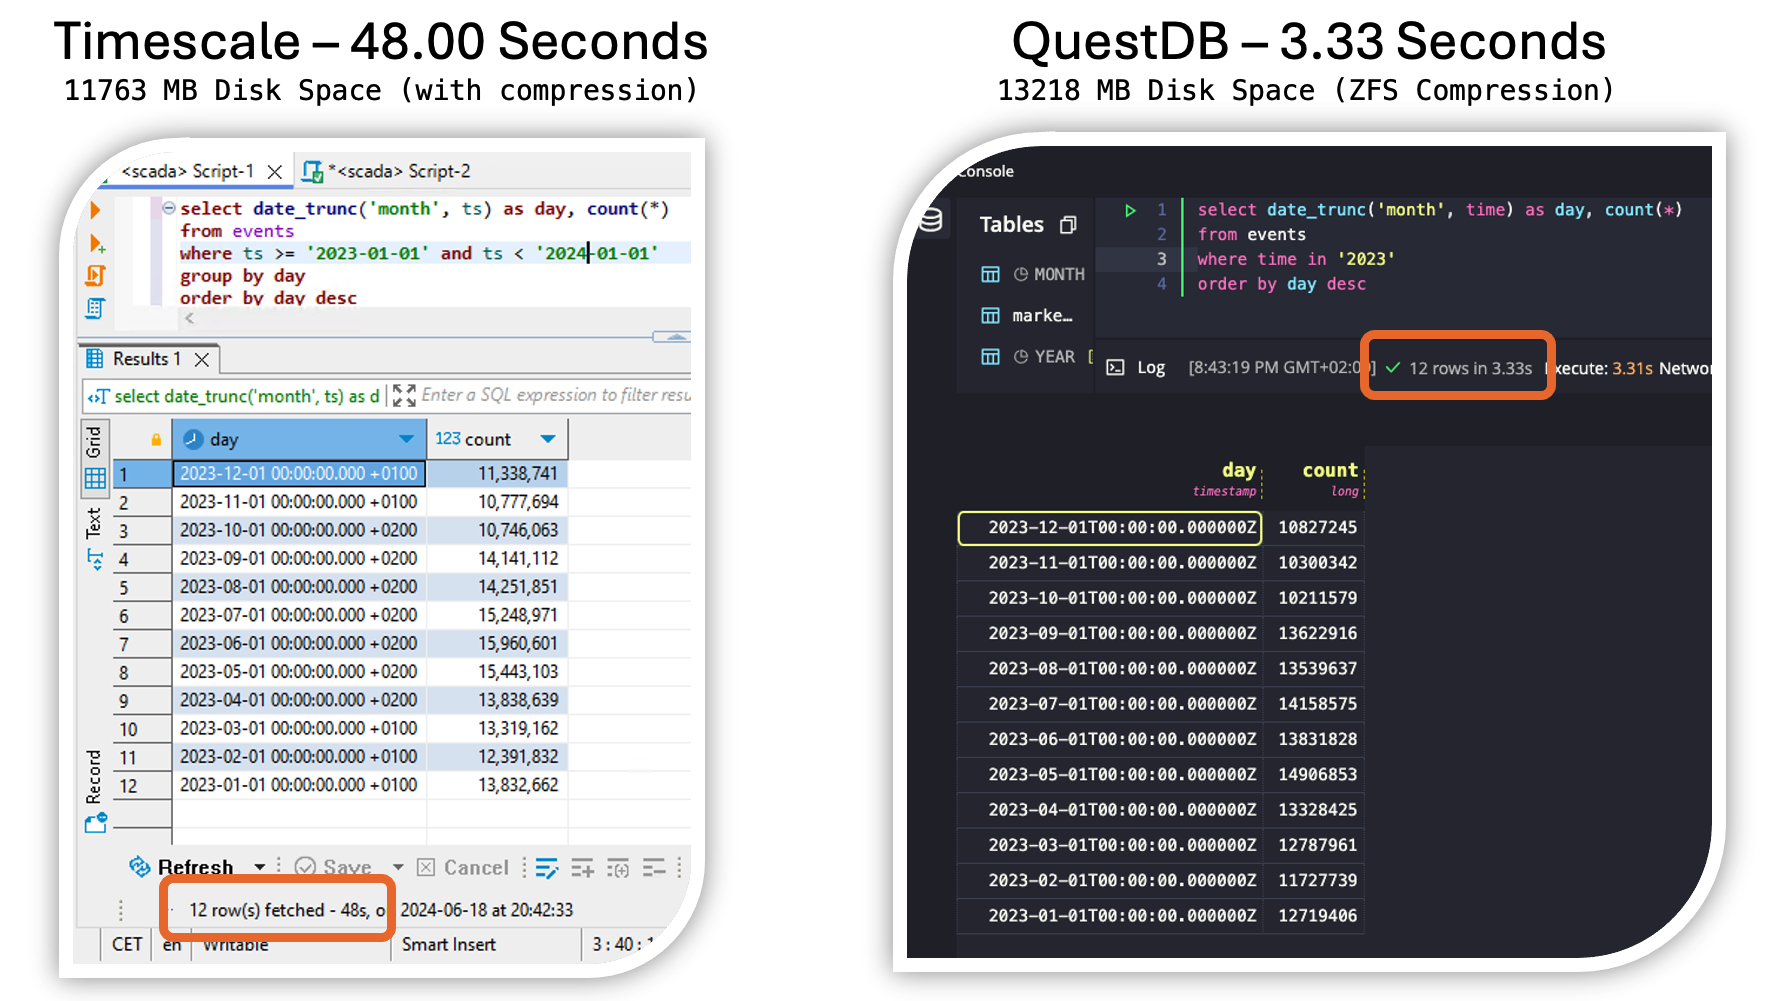
My first tests with QuestDB on 10 years of home automation data (1.4 billion rows) are promising.
👉 Fast ingestion of parquet files (~1 hour on an old Intel NUC i5)
I have stored my data in parquet files, one per month, and imported it with a simple Python script. The import on my really old Intel NUC i5 took only about one hour. I’ve never been able to do this so quickly with any other database.
🤔 Btw.: I think storing data in #parquet files, or any other open table format, like Apache Iceberg, is one of the best choices to keep data. Because it’s independent of a database engine.
👉 Familiar SQL syntax. I experienced that QuestDB has a powerful SQL engine. I converted some Postgres SQL statements to QuestDB without big issues or changes. And I love SQL 💚
👉 Great query response times – see image. Not a representative query, but still impressive speed.
👉 By using ZFS with compression the used disk space can be reduced to a good value.
Do you want to log your OPCUA data to QuestDB? I have added this option to the automation-gateway.com seven days ago.
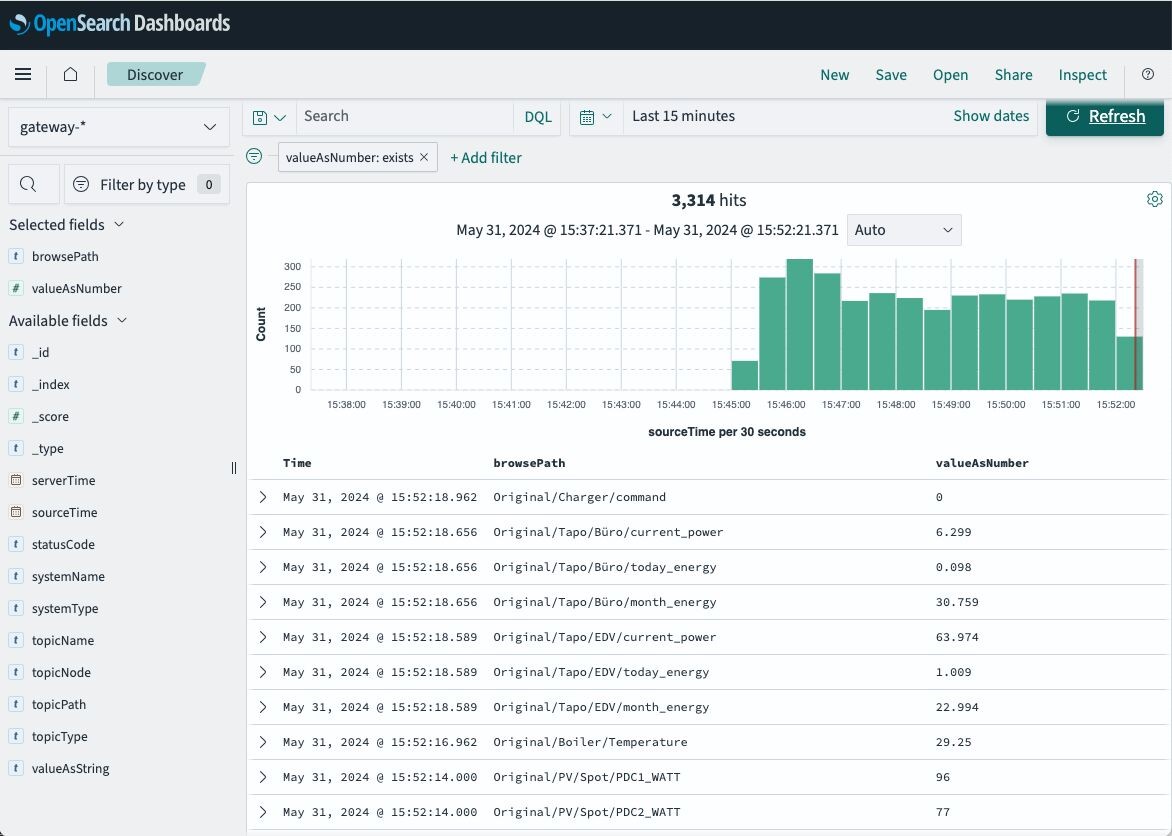
For the OpenSearch and Elasticsearch fans: the automation-gateway.com can now log OPC UA, MQTT, PLC4X values to OpenSearch!
Makes sense if you have lot of text values, to leverage the full text search capabilities. But for timeseries it is nice as well, the Kibana tool is great to create dashboards.
The integration of SCADA with Spark and WinCC Open Architecture offers a powerful and versatile solution that combines real-time data processing, advanced analytics, scalability, and flexibility. This combination empowers you to optimize industrial processes, make data-driven decisions, and stay ahead in a rapidly evolving technological landscape.
By utilizing my 5-year-old project that implemented a native Java manager for WinCC Open Architecture, I have enabled the integration of SCADA with Spark for the current WinCC OA Version 3.19.
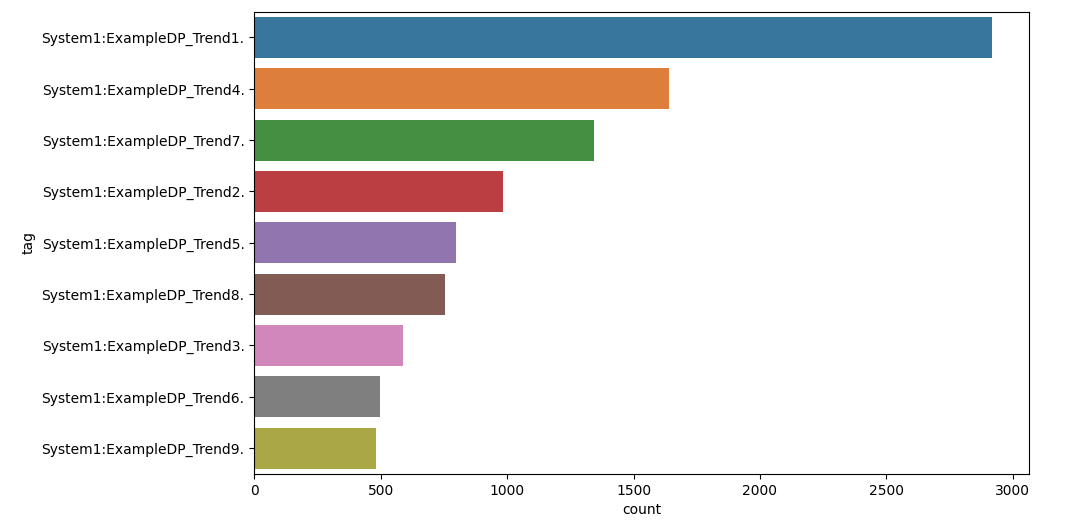
Very simple example is to analyze tags and the corresponding amount of values in your SCADA system can provide valuable insights into the distribution and characteristics of the data.
res = spark.sql('SELECT tag, count(*) count FROM events GROUP BY tag ORDER by count(*) DESC')
data = res.toPandas()
plt.figure( figsize = ( 10, 6 ) )
sns.barplot( x="count", y="tag", data=data)
plt.show()
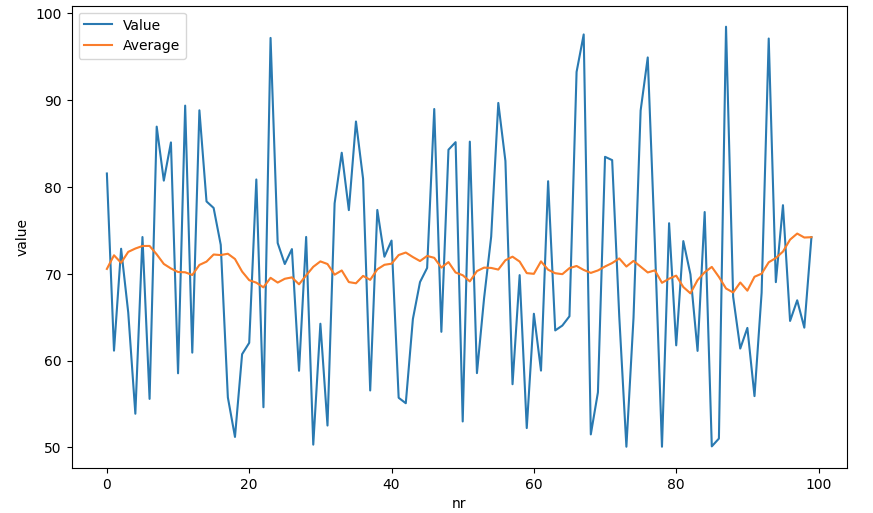
Another simple example is to calculate the moving average of 10 preceding and following values for a given data point in a time series, you can use a sliding window approach:
data = spark.sql("""
SELECT ROUND(value,2) as value,
  AVG(value) OVER (PARTITION BY tag ORDER BY ts
  ROWS BETWEEN 10 PRECEDING AND 10 FOLLOWING) avg
  FROM events
  WHERE tag = 'System1:ExampleDP_Trend2.'
  ORDER BY ts DESC
  LIMIT 100
  """).toPandas()
data = data.reset_index().rename(columns={"index": "nr"})
sns.lineplot(data=data, x='nr', y='value', label='Value')
sns.lineplot(data=data, x='nr', y='avg', label='Average')
plt.show()
By leveraging the distributed file system, you can take advantage of Spark’s parallel processing capabilities. The distributed file system ensures that the data frame is partitioned and distributed across the nodes of the Spark cluster, enabling simultaneous processing of data in parallel. This distributed approach enhances performance and scalability, allowing for efficient handling of large volumes of real-time SCADA data.
I have achieved real-time data streaming from WinCC OA to a Spark cluster with a Websocket-Server based on the Java manager. This streaming process involves continuouslytransferring SCADA real-time data from the WinCC OA system to the Spark cluster for further processing and analysis.
Once the data is received by the Spark cluster, I store it as a data frame on the distributed file system (DFS). A data frame is a distributed collection of data organized into named columns, similar to a table in a relational database. Storing the data frame on the distributed file system ensures data persistence and allows for efficient processing and retrieval.
bulk = []
last = datetime.datetime.now()
def on_message(message):
    global bulk, last, start
    data = json.loads(message)

    if "DpQueryConnectResult" in data:
        values = data["DpQueryConnectResult"]["Values"]
        for tag, value in values:
            #print(tag, value)
            data = {"ts": datetime.datetime.now(), "tag": tag, "value": value}
            bulk.append(data)

    now =datetime.datetime.now()
    time = datetime.datetime.now() - last
    if time.total_seconds() > 10 or len(bulk) >= 1000:
        last = now

        # Create a new DataFrame with the received data
        new_df = spark.createDataFrame(bulk, schema)

        new_df.write \
            .format("csv") \
            .option("header", "true") \
            .mode("append") \
            .save("events.csv")

        bulk = []
Once the SCADA data is stored as a distributed data frame on the Spark cluster’s distributed file system, you can leverage Spark’s parallel processing capabilities to efficiently process the data in parallel.
By combining SCADA (Supervisory Control and Data Acquisition) with Spark’s powerful data processing capabilities, I have created a solution that can handle large volumes of real-time data efficiently. This enables faster and more accurate decision-making based on the insights derived from the processed data.
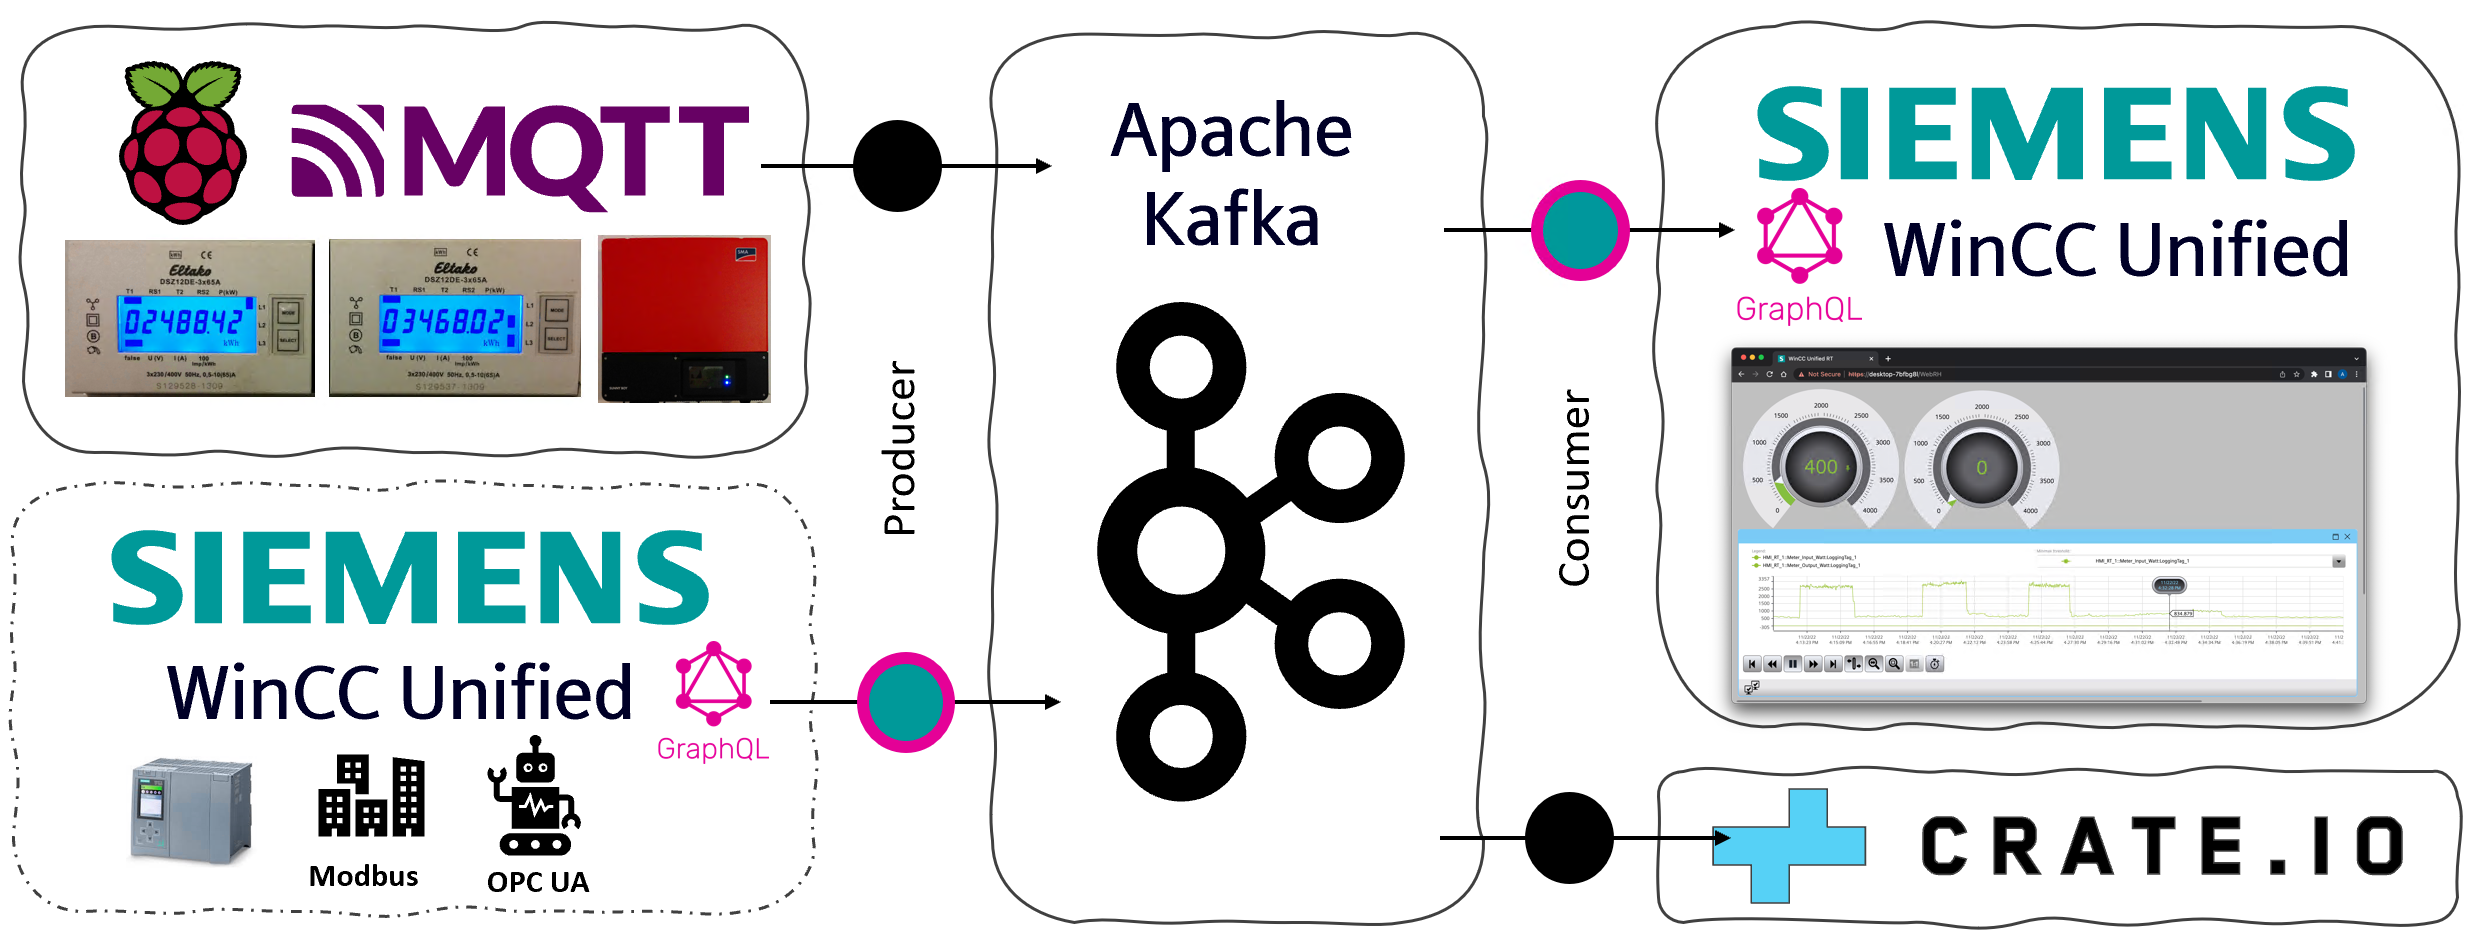
With the GraphQL Server in WinCC Unified V18 we can now integrate various (IT) data platforms with simple programs. Those programs can be written in Python, Java, Kotlin, Go, JavaScript, or whatever kind of programming language you prefer.
In my case I have used Kotlin to implement a simple Apache KafkaConsumer, which maps and writes values from my Home-Automation to the WinCC Unified SCADA system.
I can now use WinCC Unified for visualisation, even if I don’t have any PLC at home. WinCC Unified can be used as a Low- or No-Code platform to create fancy Web-Based visualisations with real-timevalues from any kind of data source.
WinCC Unified also has great alarming features. Alarm handling can be done in WinCC Unified and alerts could also be published back to the streaming platform with a producer.
I collect my Home-Automation values from a Raspberry Pi, which reads values from power meters, temperature sensors, or data via Bluetooth from my PV Converter. The values are published to a MQTT Broker. And from that MQTT Broker I bring my values to Apache Kafka and then to the WinCC Unified system.
With the GraphQL Server of WinCC Unified it would also be easily possible to implement an Apache Kafka Producer, so that values from PLC’s can easily be published to Apache Kafka, or any other data streaming platform.
From Apache Kafka I write my values to WinCC Unified and additionally to a CrateDB. CrateDB is a great NoSQL database with the power of SQL and it is highly scalable. It can be used for data analytics, machine learning, Grafana Dashboard, and more…
For sure you can also grab the data directly from the MQTT broker and bring it directly into WinCC Unified via the GraphQL Server without a streaming platform, but a streaming platform has additional benefits, which are not covered in this post…
PostgreSQL table with ts+key as primary key: ~43GB
PostgreSQL wide column table with ts as primary key : 247GB
Cassandra wide column table with ts as primary key: 4.5GB
Strange that in PostgreSQL a table with much less rows (but much more columns) needs a lot of more space (both tables store the same amount of data). )
It seems that the Apache Cassandra Column Store can compress the columns pretty good – factor 10 less disk space!
The source table in PostgreSQL (TimescaleDB) with a timestamp and a key column and 8 data columns had about 170 Mio rows.
CREATE TABLE candles
(
    instrument character varying(10) NOT NULL,
    ts timestamp(3) without time zone NOT NULL,
    o numeric,
    h numeric,
    l numeric,
    c numeric,
    primary key (instrument, ts)
)
I needed to flatten the table so that i have just the timestamp as primary key and many columns and each column is of a type. It ends up in a table with about 1.6 Mio rows and many columns.
CREATE TYPE price AS (
    o       float,
    c       float,
    h       float,
    l       float,
    volume  float
);

CREATE TABLE candles_wide
(
   ts timestamp(3) without time zone NOT NULL,
   AU200_AUD price,
   AUD_CAD price,
   AUD_CHF price,
   AUD_HKD price,
   AUD_JPY price,
   AUD_NZD price,
   ... 124 columns
Apache Cassandra wide column store table with ts as primary key and many columns.
KSQL makes it easy to read, write, and process streaming data in real-time, at scale, using SQL-like semantics. It offers an easy way to express stream processing transformations as an alternative to writing an application in a programming language such as Java or Python. https://www.confluent.io/product/ksql/
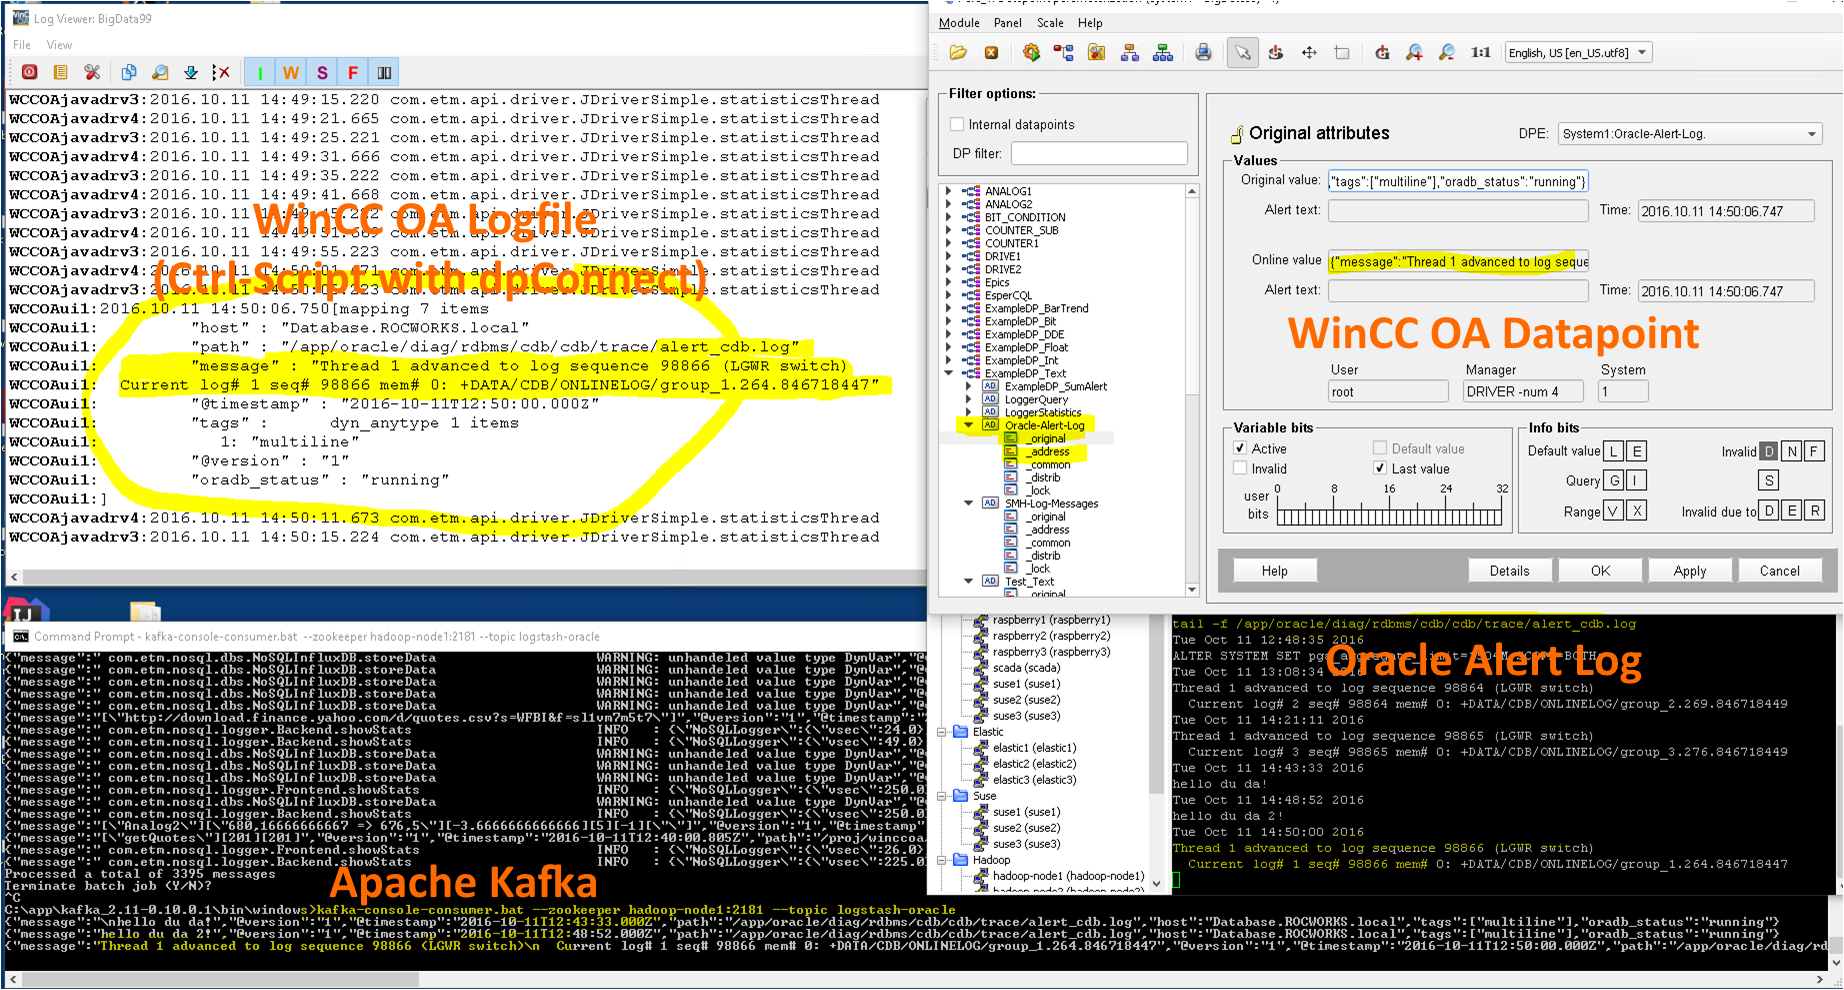
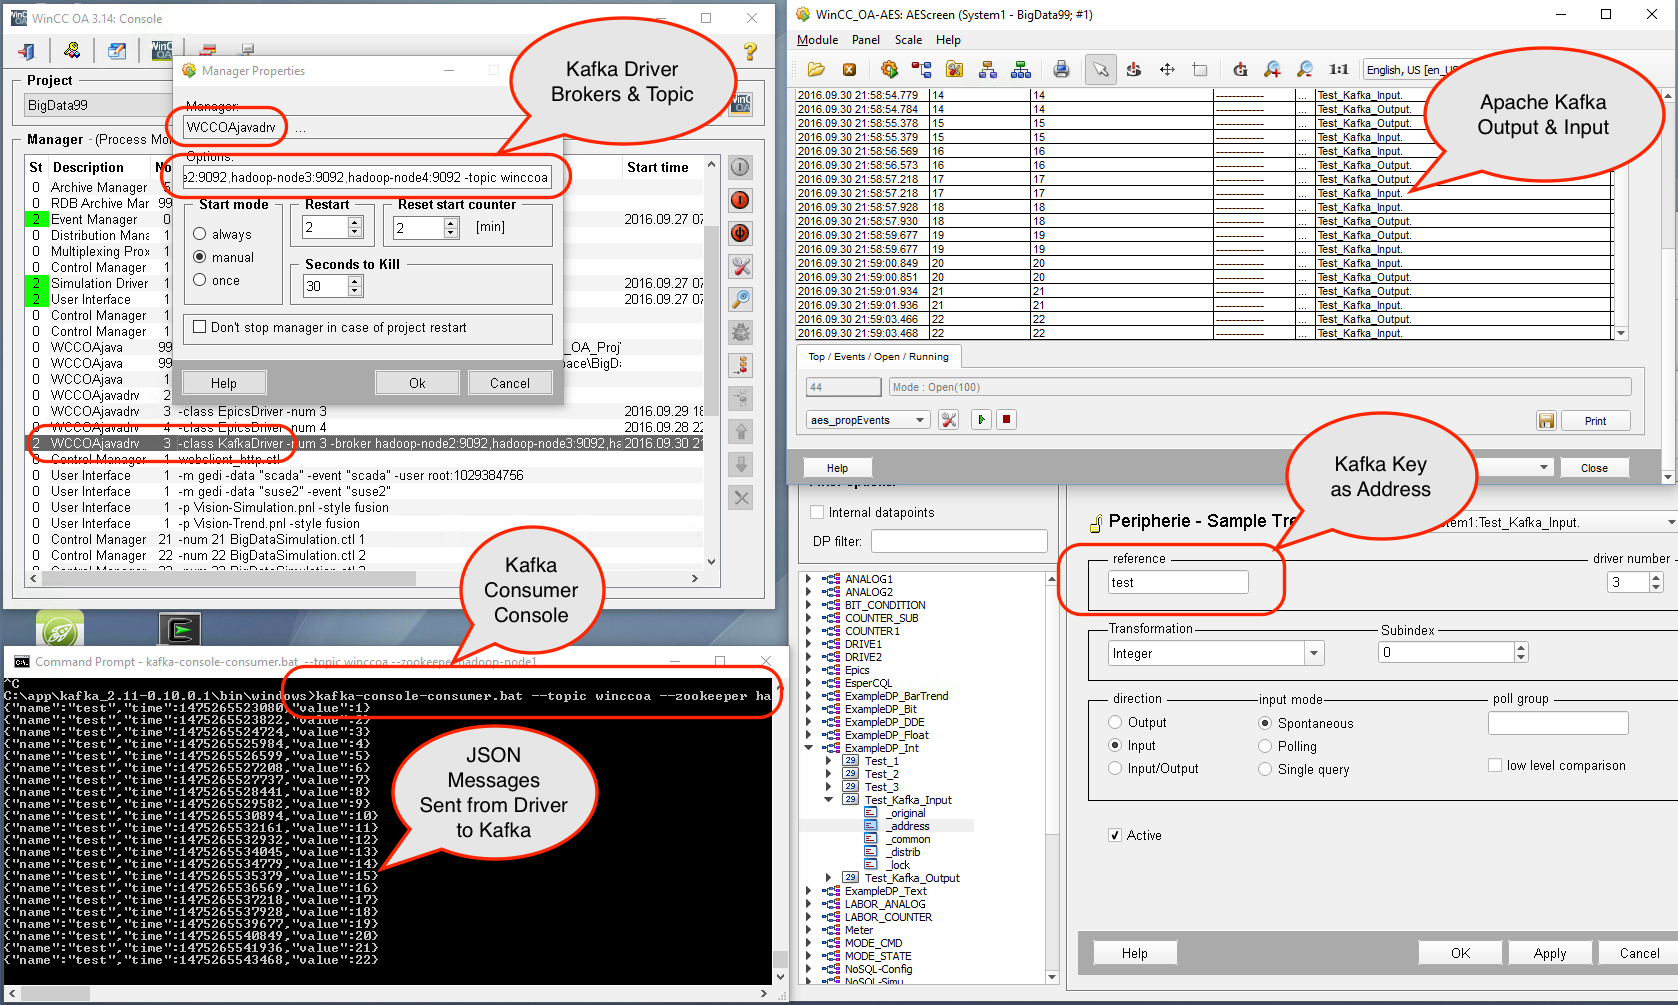
With WinCC OA Java (https://github.com/vogler75/oa4j) we can stream data from WinCC OA to Apache Kafka, use KSQL to produce some insights and send it back to WinCC OA by using a WinCC OA Driver written in Java connected to Kafka.
Attached you will find a docker-compose.yml to setup KSQL + WinCC OA Connector and Driver to test it. Just use “docker-compose up -d” to start up everything. Before you should set the “data” and “event” environment variables in the docker-compose.yml to point to a running WinCC OA project.
root@docker1:~/docker/builds/winccoa# docker-compose up -d

Creating winccoa_frontend_1 ==> collect data from OA and publish it by ZeroMQ

Creating winccoa_backend-kafka_1 ==> get the data from the Frontend and write it to Kafka

Creating winccoa_driver-kafka_1 ==> OA driver to read data from kafka.

Creating winccoa_zookeeper_1
Creating winccoa_kafka_1
Creating winccoa_schema-registry_1
Creating winccoa_ksql-cli_1
We use Docker to startup WinCCOA Mangers (frontend, backend) and Drivers.
Afterwards you can start KSQL: docker-compose exec ksql-cli ksql-cli local –bootstrap-server kafka:29092
Create a stream of the topic which is sent from WinCC OA to kafka (currently every change of value in WinCC OA is sent to Kafka):
CREATE STREAM Scada_FloatVar (TimeMS BIGINT, Status BIGINT, Value DOUBLE) WITH (kafka_topic=’Scada_FloatVar’, value_format=’JSON’);
Create a result table in KSQL which will be read by the WinCC OA Driver, here we detect if a datapoint changes more often than 5 times in 10 seconds. Just a simple example to show how KSQL can be used:
CREATE TABLE result WITH (PARTITIONS=1) AS SELECT rowkey AS “Name”, count(*) AS “Value” FROM Scada_FloatVar WINDOW TUMBLING (size 10 second) GROUP BY rowkey HAVING count(*) > 5;
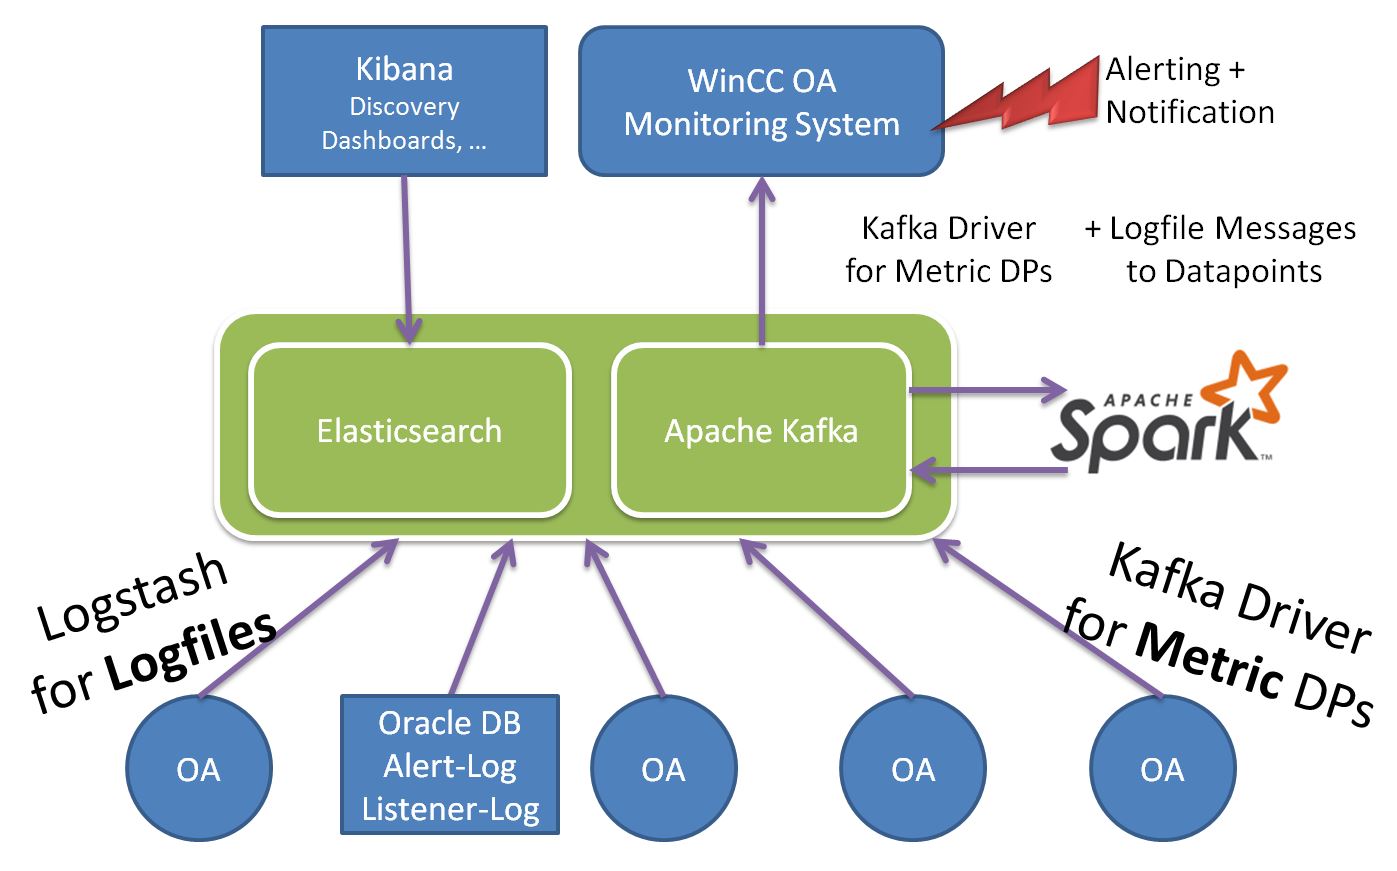
For example we do this with the Oracle Alert Log. Very often an Oracle Database is used with WinCC OA to store history values. But a lot of times no one takes care of the Oracle database. At least the Alert-Log file should be observed. With Logstash, Apache Kafka and the WinCC OA Apache Kafka Driver we can send alert log messages from the Oracle database(s) to a WinCC OA monitoring system.
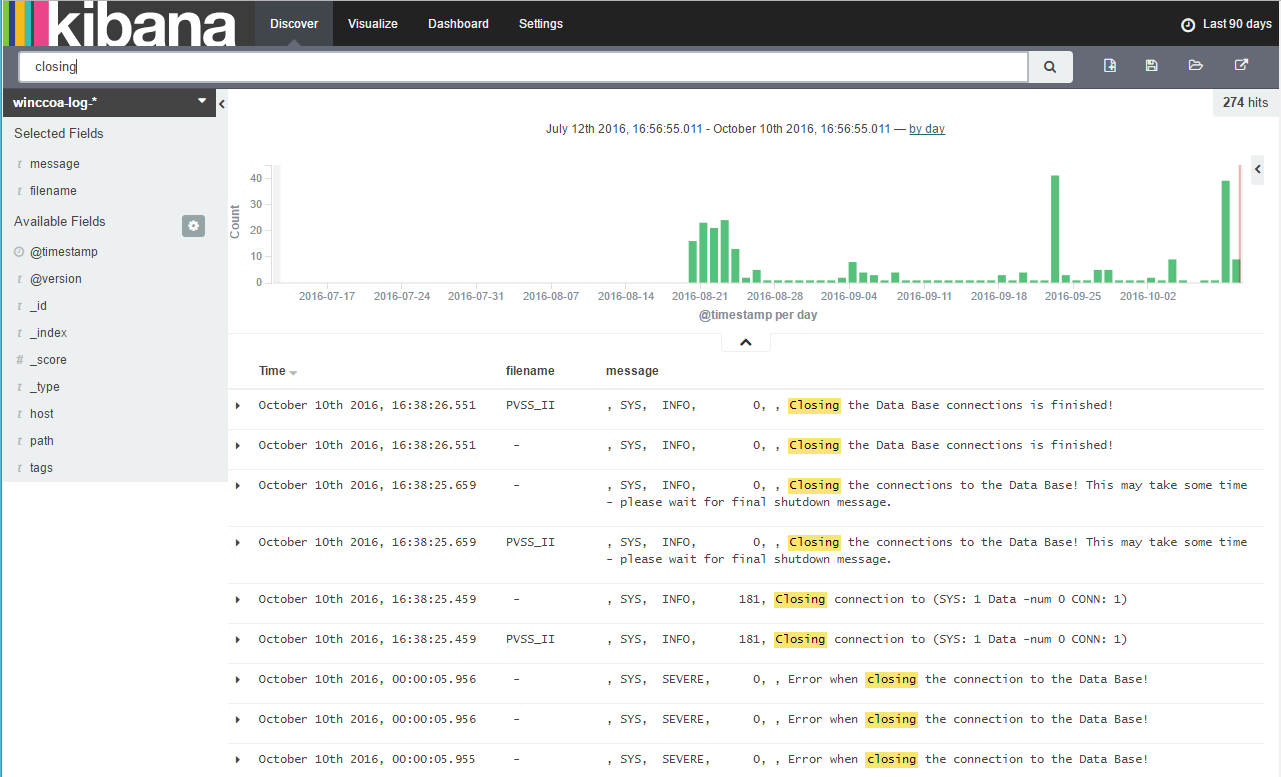
With Logstash we can collect the logs of WinCC OA systems and write it to Elasticsearch. Multiple WinCC OA system’s can be observed with a central log database…
With Kibana the logs can be easily discovered – I now see errors what i haven’t seen before in my system…
In parallel the log messages are written to Apache Kafka. With Apache Spark we can now observe the log streams and detect anomalies… a very simple observation could be to just simple count the amount of log messages per timeframe …
Keep in Mind: It is not a comparison of the databases only. With Oracle we used the WinCC OA RDB Manager with OA Query-RDB Direct option, and the RDB-Manager has lot of more functionalities than the NoSQL Prototyp! The other databases were tested with a NoSQL Logger Prototyp written in Java, and the implementations for writing and reading are different, because there are different interfaces for each database – for PostgreSQL we used the PostgreSQL JDBC driver, MongoDB has it’s own Java API and InfluxDB uses REST/HTTP. So, not only the speed of the database itself is compared – also the interfaces to WinCC OA and the implementations of reading are taken into account.
Oracle and OA RDB-Manager Results:
2016.07.29 09:09:03.302[“start…”]
2016.07.29 09:09:39.628[36.326][33669]
2016.07.29 09:11:22.051[“start…”]
2016.07.29 09:11:36.213[14.159][33669]
it is faster than MongoDB. And our InfluxDB is running on a MacMini (Hyper-V) and the data is stored on a shared Synology NAS for home usage (DS414 slim) – much less power for InfluxDB compared to the four 7.2k disks and to the i7 where the Oracle DB and MonogDB is running on.