Category Archives: Frankenstein

Replicate and Archive Data from a MQTT Broker to MonsterMQ

Here’s a straightforward example of how data replication can be achieved using the Frankenstein Automation-Gateway.com to transfer data from a remote broker to a local MonsterMQ Broker.

The local MonsterMQ Broker is configured so that data is stored in TimescaleDB to maintain a historical record. This process converts the current state of the UNS into archived historical data.

It will also create a Frankenstein OPC UA Server, allowing you to access the data from the MQTT broker. However, since we have it data-agnostic, all the data in the OPC UA Server will be available as a string data type.

Monster.yaml

Create a file monster.yaml with this content :

TCP: 1883 
WS: 1884
SSL: false
MaxMessageSizeKb: 64
QueuedMessagesEnabled: false

SessionStoreType: POSTGRES
RetainedStoreType: POSTGRES

ArchiveGroups:
  - Name: "source"
    Enabled: true
    TopicFilter: [ "source/#" ]
    RetainedOnly: false
    LastValType: NONE
    ArchiveType: POSTGRES

Postgres:
  Url: jdbc:postgresql://timescale:5432/postgres
  User: system
  Pass: manager

Frankenstein.yaml

Create a file frankenstein.yml with this content and adapt the Host of the soruce broker and the Topic paths which you want to replicate from the source to your local MonsterMQ Broker.

Servers:
  OpcUa:
    - Id: "opcsrv"
      Port: 4840
      EndpointAddresses:
        - linux0 # Change this to your hostname!
      Topics:
        - Topic: mqtt/source/path/Enterprise/Dallas/#
Drivers:
  Mqtt:
    - Id: "source"
      Enabled: true
      LogLevel: INFO
      Host: test.monstermq.com # Change this to your source MQTT Broker!
      Port: 1883
      Format: Raw
Loggers:
  Mqtt:
    - Id: "source"
      Enabled: true
      LogLevel: INFO
      Host: 172.17.0.1
      Port: 1883
      Format: Raw
      BulkMessages: false
      LogLevel: INFO
      Logging:
        - Topic: mqtt/source/path/Enterprise/Dallas/#

Docker Compose

Create a docker-compose.yaml file with this content and then start it with docker-compose up -d

services:
  timescale:
    image: timescale/timescaledb:latest-pg16
    container_name: timescale
    restart: unless-stopped
    ports:
      - "5432:5432"
    volumes:
      - timescale_data:/var/lib/postgresql/data
    environment:
      POSTGRES_USER: system
      POSTGRES_PASSWORD: manager
  monstermq:
    image: rocworks/monstermq:latest
    container_name: monstermq
    restart: unless-stopped
    ports:
      - 1883:1883
      - 1884:1884
    volumes:
      - ./log:/app/log
      - ./monster.yaml:/app/config.yaml
    command: ["+cluster", "-log FINE"]
  frankenstein:
    image: rocworks/automation-gateway:1.37.1
    container_name: frankenstein
    restart: always
    ports:
      - 1885:1883
      - 4840:4840
    environment:
      JAVA_OPTS: '-Xmx1024m'
    volumes:
      - ./frankenstein.yaml:/app/config.yaml
      - ./security:/app/security
volumes:
  timescale_data:      

Exploring My Home Automation Architecture

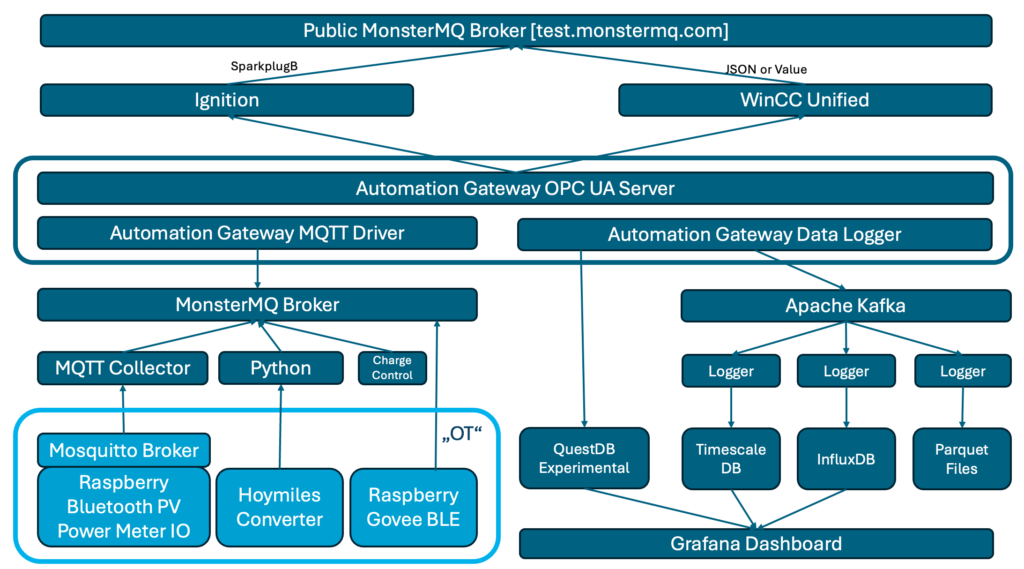
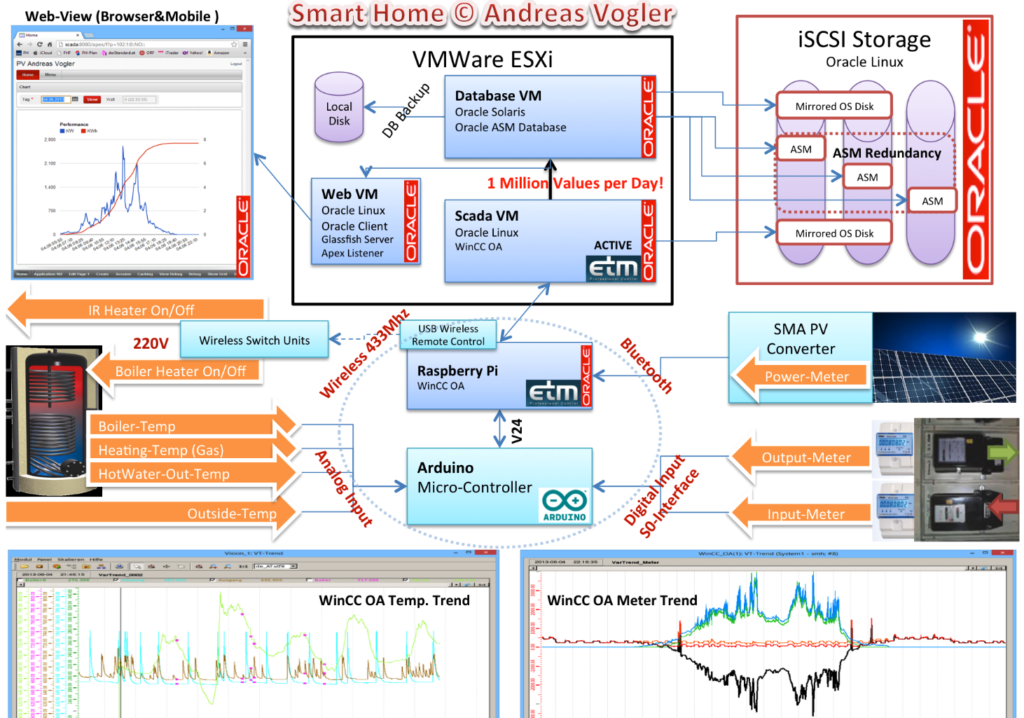
My home automation setup has been an ongoing project, evolving over the last 10–15 years. It started with a simple goal: to track data from my photovoltaic (PV) system, power meters, and temperature sensors, all connected through Raspberry Pi devices. It started with Oracle and over time, it’s grown into a more complex architecture that incorporates multiple layers of data collection, processing, and visualization.

1. Data Collection with Raspberry Pi and MQTT

At the core of my setup are Raspberry Pi devices that connect various sensors, including those for monitoring power generation (PV) by bluetooth, power consumption by meters giving digital signals, and temperature sensors. These Pi devices act as data collectors, feeding data into a local Mosquitto broker. A local broker on the device can serve as a short-term buffer, before it’s synchronized to my central MonsterMQ broker, by using a persistant session and QoS>0.

2. MonsterMQ Broker as the Central Hub

The MonsterMQ broker is the central point where data from all sources is collected. It serves as a bridge, collecting data from the local Mosquitto broker and preparing it for further processing and storage. Before building my own broker, MonsterMQ, I used Mosquitto. Now that I have my own broker, I use MonsterMQ, both to ensure it gets thoroughly tested and to leverage its features. Additionally, in the future, I can use MonsterMQ to store incoming values directly in Apache Kafka. As a database engineer, I appreciate MonsterMQ because it allows me to view the broker’s current state by querying a PostgreSQL database. This lets me see connected clients, their connection details, source IP addresses, and all subscriptions with their parameters..

3. Automation-Gateway for Data Flexibility

To expand the possibilities of what I can do with the data, I use the Automation-Gateway. This tool collects values from MonsterMQ and serves two primary functions:

  • Integration with Apache Kafka: By publishing data to Apache Kafka, I maintain a reliable stream that acts as an intermediary between my data sources and the storage databases. This setup provides resilience, allowing me to manage and maintain the databases independently while keeping the data history intact in Kafka.
  • OPC UA Server Exposure: The Automation-Gateway also exposes data as an OPC UA server, making it accessible to industrial platforms and clients that communicate over OPC UA. This can be achieved just with a simple YAML configuration file.

4. Experimental Integrations: Ignition and WinCC Unified

On top of this setup, I’ve added experimental connections to Ignition and WinCC Unified. Both of these platforms connect to the Automation-Gateway OPC UA Server. Just for testing those systems are publishing values to my public MQTT broker at test.monstermq.com. While these integrations aren’t necessary, they’re helpful for testing and exploring new capabilities.

5. Long-Term Data Storage with TimescaleDB, QuestDB, and InfluxDB

Data from Kafka is stored in multiple databases:

  • InfluxDB: My home-automation started with Oracle and then moved to InfluxDB
  • TimescaleDB: Since I am still an advanced SQL user, I needed a database with strong SQL capabilities. Therefore, I added TimescaleDB and imported historical data into it.

Amount of records as of today: 1_773_659_197

Additinally the Automation-Gateway is writing the data now to QuestDB. It is used for experimental data logging and alternative time-series database exploration. Potentially will replace the other databases. I was blown away by how quickly I was able to import 1.5 billion historical data points into QuestDB.

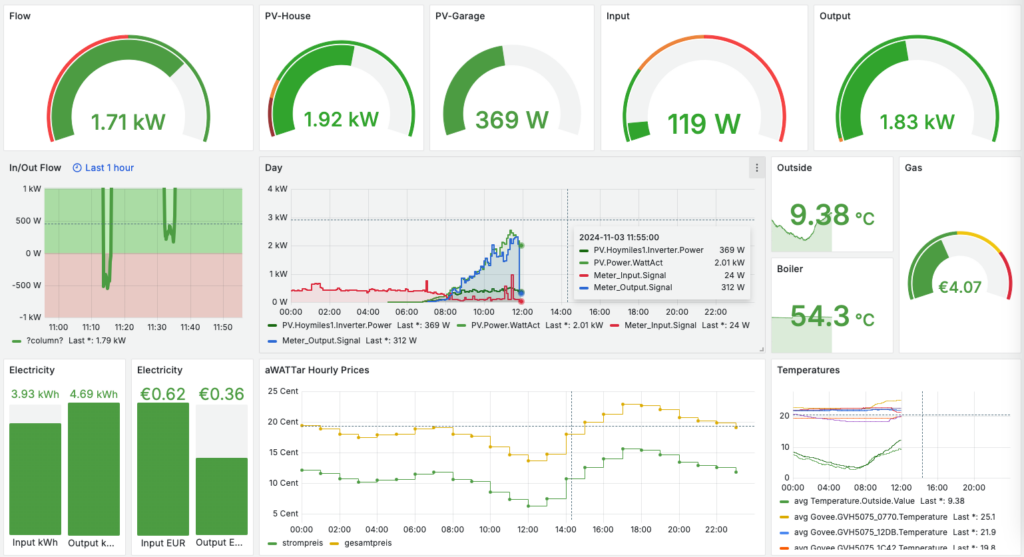
These databases serve as long-term storage solutions, allowing me to create detailed dashboards in Grafana. By keeping Kafka as the layer between my data sources and the databases, I ensure flexibility for database maintenance, as Kafka retains the historical data.

6. Data Logging with MonsterMQ

The public MonsterMQ broker is configured to write data of topics below “grafana/#” directly into a TimescaleDB table. This setup allows you to see updates in Grafana whenever new data is published. In this specific Grafana dashboard configuration, if you publish a JSON object with a key ‘value’ and a numeric value, such as {“value”: 42}, it will appear on the dashboard almost instantly. Here is a public dashboard.

select 
  time, array_to_string(topic,'/') as topic, 
  (payload_json->>'value')::numeric as value 
from grafanaarchive
where $__timeFilter(time)
and payload_json->>'value' is not null
and payload_json->>'value' ~ '^[0-9]+(\.[0-9]+)?$'
order by time asc

7. SparkplugB Decoding with MonsterMQ

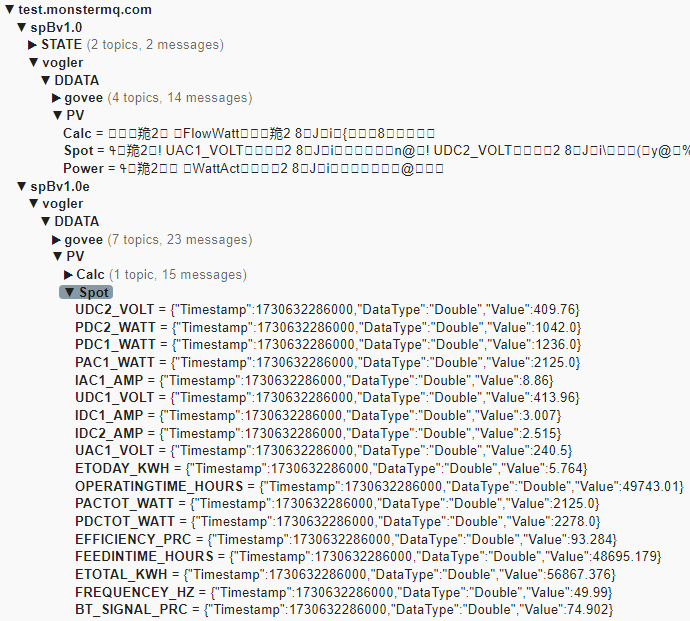
The public MonsterMQ broker is configured to decode and expand SparkplugB messages. Expanded messages can be found under the topic “spBv1.0e“. Ignition publishes some of my home automation data via SparkplugB to the public broker, and you’re welcome to publish your own SparkplugB messages here as well.

Final Thoughts

This setup is the result of years of experimentation and adaptation to new tools. In theory, I could simplify parts of it, for example, by replacing more components with the Automation-Gateway. But I appreciate having Kafka as the buffer between data sources and databases – it offers flexibility for maintenance and helps preserve historical data.

Feel free to test the public MonsterMQ broker at test.monstermq.com. And if you’re curious, publish a JSON object with a “value” key to grafana/something to see it immediately reflected in the Grafana dashboard!

Public MonsterMQ 👽 Broker for testing !

👉 I’ve just installed MonsterMQ on a public virtual machine, hosted by Hetzner – thanks to Jeremy Theocharis awesome post! You can try it out at test.monstermq.com via TCP or Websockets at port 1883. No password, no security. If you want to leave me a message, then use your name as ClientId 😊

🔍 Want to take a look at the TimescaleDB behind it? Connect to the database on the default port 5432 using the (readonly) user “monster” with the password “monster”.

😲 I’ve intentionally set it to store all messages, not just retained ones, in a table “alllastval” for testing purposes.

📈 Additionally, messages published on topics matching “Test/#” will be archived in a history table “testarchive”!

ℹ️ Keep in mind, it’s hosted on a small machine, and every published value is being written and updated in a PostgreSQL table. So, please don’t expect massive throughput or run performance tests.

I’d love for you to try it out. If you find any issues, let me know, or drop an issue on GitHub!

Publish OPC UA and MQTT Data to the Cloud with Automation-Gateway

Publish OPC UA and MQTT Data to the Cloud with Automation-Gateway – inspired by a users request 💡

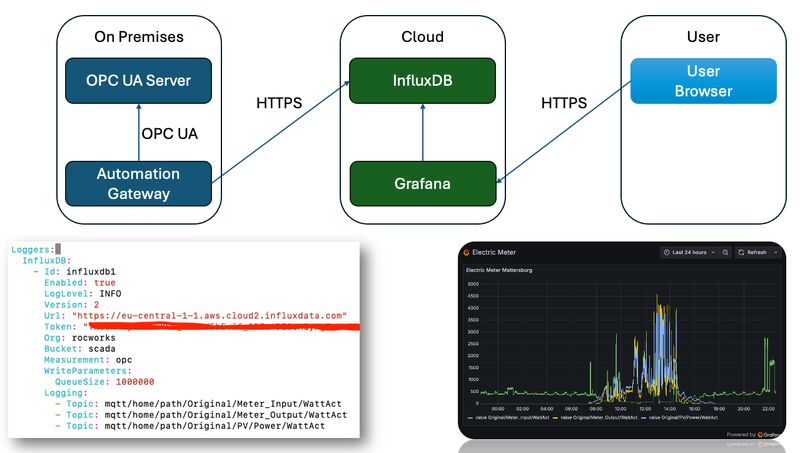
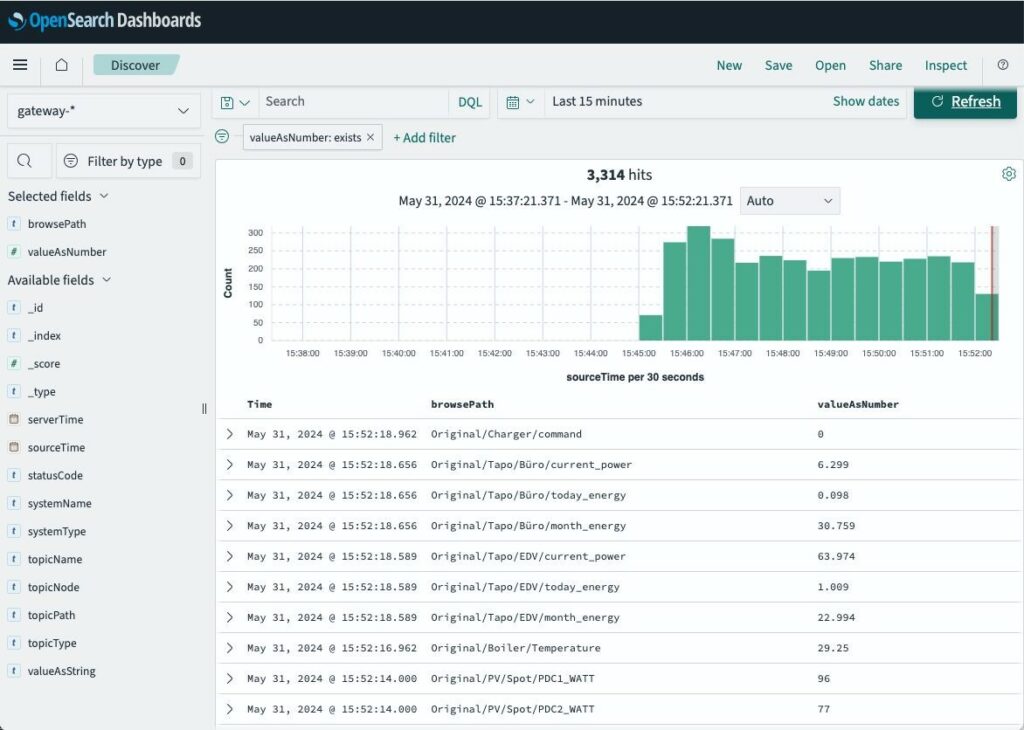
If you have a local 𝗢𝗣𝗖 𝗨𝗔 server or 𝗠𝗤𝗧𝗧 broker and want to bring that data to a 𝗰𝗹𝗼𝘂𝗱-𝗯𝗮𝘀𝗲𝗱 dashboard, Automation-Gateway.com makes it simple. You can easily publish your data to 𝗜𝗻𝗳𝗹𝘂𝘅𝗗𝗕 Cloud and visualize it in 𝗚𝗿𝗮𝗳𝗮𝗻𝗮 — all without complex setups.

I recently added support for InfluxDB V2 to the gateway, allowing you to configure an Influx token and bucket for data publishing. With just a few steps, your local OPC UA or MQTT data can be 𝘀𝘁𝗼𝗿𝗲𝗱 𝗶𝗻 𝘁𝗵𝗲 𝗰𝗹𝗼𝘂𝗱 and displayed in Grafana in real time.

Zenoh & Automation-Gateway.com

OPC UA data to Zenoh? Have you ever used zenoh.io? It’s really cool.

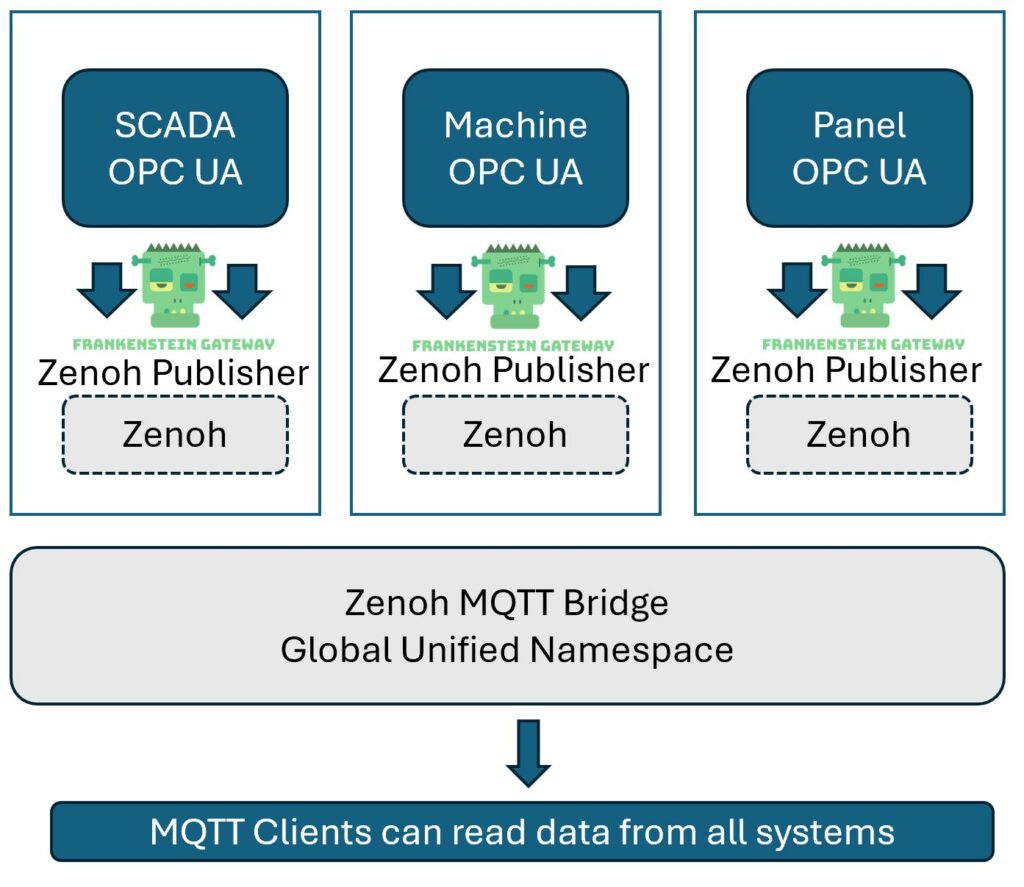
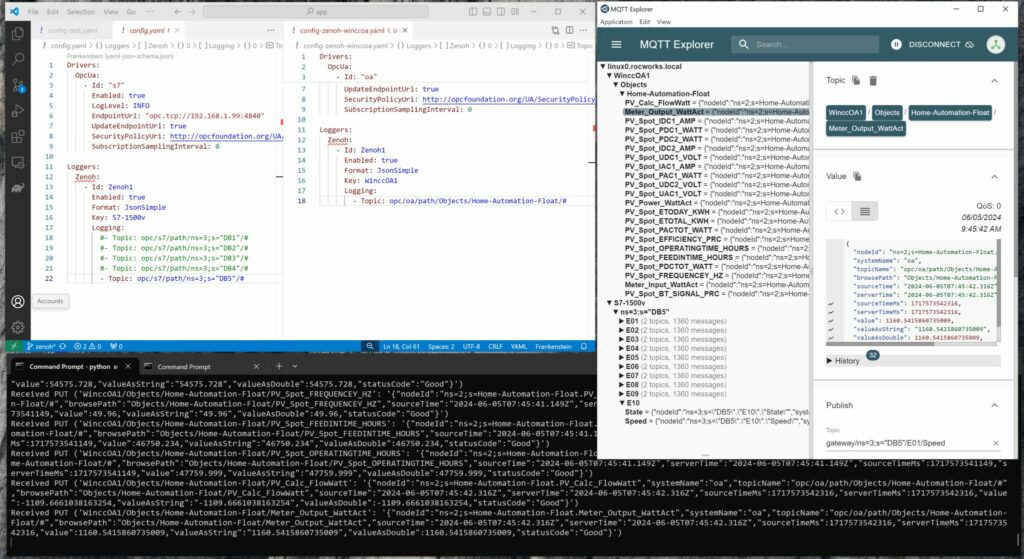
👉 I have implemented a Zenoh publisher in my fun open-source project, the Automation-Gateway.com. It can now bring data from OPC UA/MQTT/PLC4X to Zenoh, with just some lines of configuration.

😎 The cool point about Zenoh is that you publish the data from multiple sources, from multiple machines to the data centric Zenoh network – there is no central server. You can then startup a Zenoh client somewhere and subscribe to data coming from any of those sources.

🤫 It is like a distributed UNS.

🤩 And there is even more, they have a Zenoh MQTT bridge, so MQTT clients can connect to this bridge and subscribe to all the available data in the Zenoh network. A new machine/HMI/publisher can be added on the fly and the data will be visible immediately in the Zenoh MQTT bridge.

👉 See the screenshots. I deployed the gateway to two machines to publish data from a S7 and from a WinCC OA system to the Zenoh network. Then I started a Zenoh MQTT bridge to subscribe to some of the data with a MQTT client.

🤠 Disclaimer: I did not take care about security. I did not do any performance tests.

QuestDB: My time series data’s new best friend? 📈

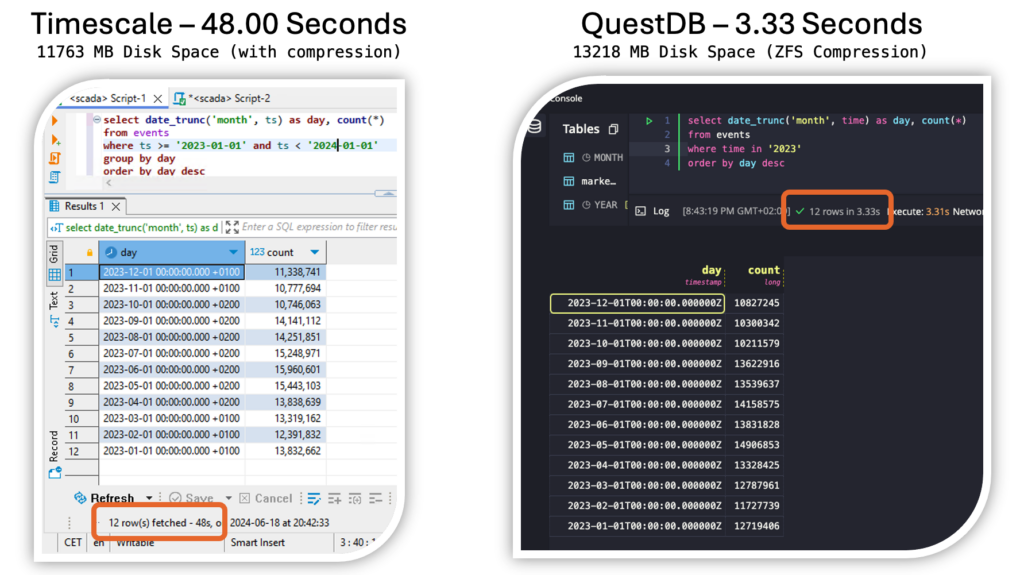
My first tests with QuestDB on 10 years of home automation data (1.4 billion rows) are promising.

👉 Fast ingestion of parquet files (~1 hour on an old Intel NUC i5)

I have stored my data in parquet files, one per month, and imported it with a simple Python script. The import on my really old Intel NUC i5 took only about one hour. I’ve never been able to do this so quickly with any other database.

🤔 Btw.: I think storing data in #parquet files, or any other open table format, like Apache Iceberg, is one of the best choices to keep data. Because it’s independent of a database engine.

👉 Familiar SQL syntax. I experienced that QuestDB has a powerful SQL engine. I converted some Postgres SQL statements to QuestDB without big issues or changes. And I love SQL 💚

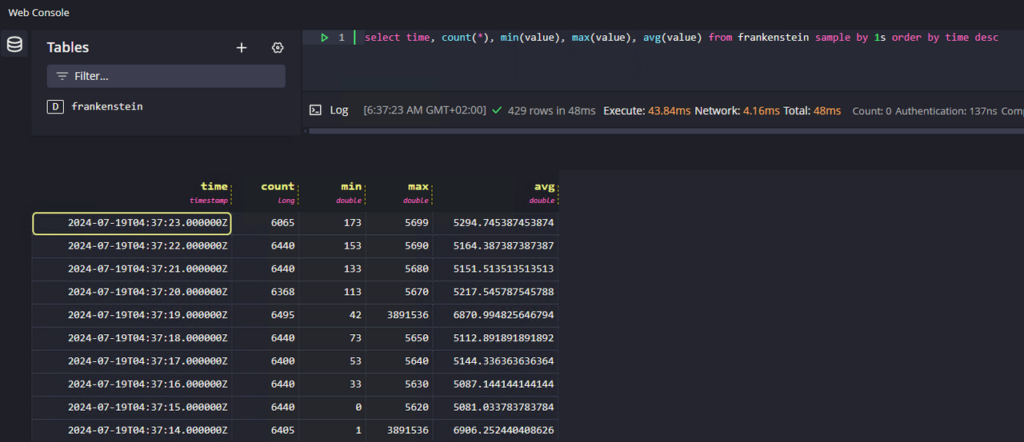
👉 Great query response times – see image. Not a representative query, but still impressive speed.

👉 By using ZFS with compression the used disk space can be reduced to a good value.

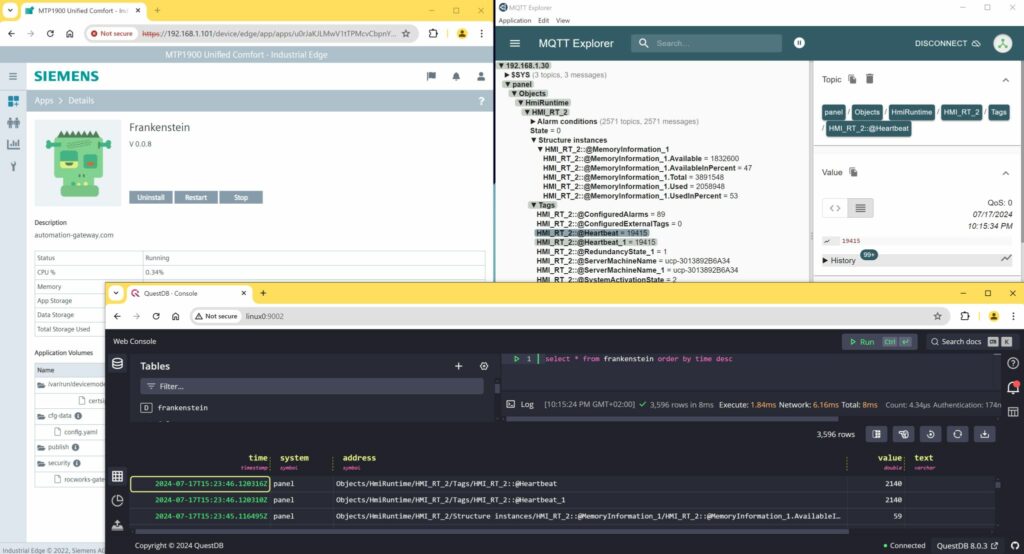
Do you want to log your OPCUA data to QuestDB? I have added this option to the automation-gateway.com seven days ago.

OPC UA Node Tree to MQTT

With just 20 lines of configuration you can publish a OPCUA tree of values to MQTT …

in this example to the HiveMQ cloud … 👉 with the automation-gateway.com

It also supports PLC4x connected devices/plcs…

It can also publish values to Kafka or SQL databases…

git clone https://github.com/vogler75/automation-gateway.git
cd source\app
set GATEWAY_CONFIG=configs/config-opcua-mqtt.yaml
gradle run

Drivers:
  OpcUa:
  - Id: "demo"
    Enabled: true
    LogLevel: INFO
    EndpointUrl: "opc.tcp://192.168.1.3:62541"
    UpdateEndpointUrl: true
    SecurityPolicyUri: http://opcfoundation.org/UA/SecurityPolicy#None
Loggers:
  Mqtt:
    - Id: mqtt1
      Enabled: true
      Host: linux0.rocworks.local
      Port: 1883
      Ssl: false
      Topic: Enterprise/Site
      Logging:
        - Topic: opc/demo/path/Objects/Demo/SimulationMass/#

Bringing PLC values to OPC UA, MQTT, GraphQL

With just some lines of configuration you can bring PLC values to OPC UA, MQTT and GraphQL. And to a variety of databases for tag logging…

💡 In that example with ModBus, but thanks to #plc4x this should work in the same way also for the other protocols supported by PLC4X.

📺 See the video, ModBus values are brought to OPC UA and MQTT.

💣 In MQTT the topic name is enriched with a UNS ISA95 topic path.

⚡ On MQTT SparkplugB encoded messages could be used.

😎 100% GUI free and Open Source.

👉 automation-gateway.com

Servers:
  GraphQL:
    - Port: 4000
      LogLevel: INFO
      GraphiQL: true

  OpcUa:
    - Port: 4841
      Enabled: true
      LogLevel: INFO      
      Topics:
        - Topic: plc/demo/node/holding-register:1:INT
        - Topic: plc/demo/node/holding-register:2:INT
        - Topic: plc/demo/node/holding-register:3:INT
Drivers:
  Plc4x:
    - Id: "demo"
      Enabled: true
      Url: "modbus://localhost:502"
      Polling:
        Time: 100
        OldNew: true
      WriteTimeout: 100
      ReadTimeout: 100
      LogLevel: INFO    

Loggers:
  Mqtt:
    - Id: mqtt1
      Enabled: true
      Host: 192.168.1.4
      Port: 1883
      Topic: modbus
      Format: Raw
      Logging:
        - Topic: plc/demo/node/holding-register:1:INT
          Target: enterprise/area1/line1/cell1/speed
        - Topic: plc/demo/node/holding-register:2:INT
          Target: enterprise/area1/line1/cell1/power
        - Topic: plc/demo/node/holding-register:3:INT
          Target: enterprise/area1/line1/cell1/torque