Category Archives: Allgemein

ElasticSearch and WinCC OA …

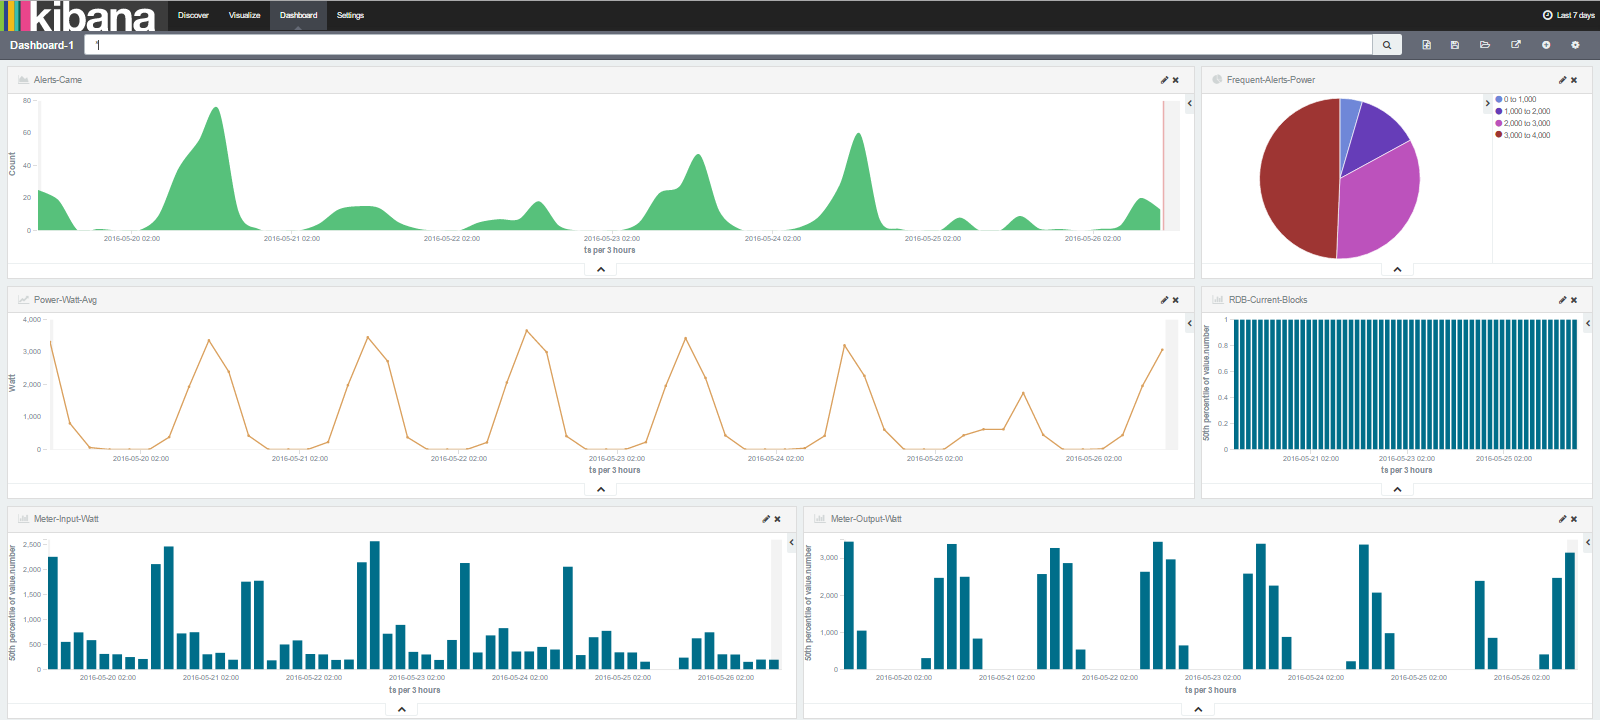
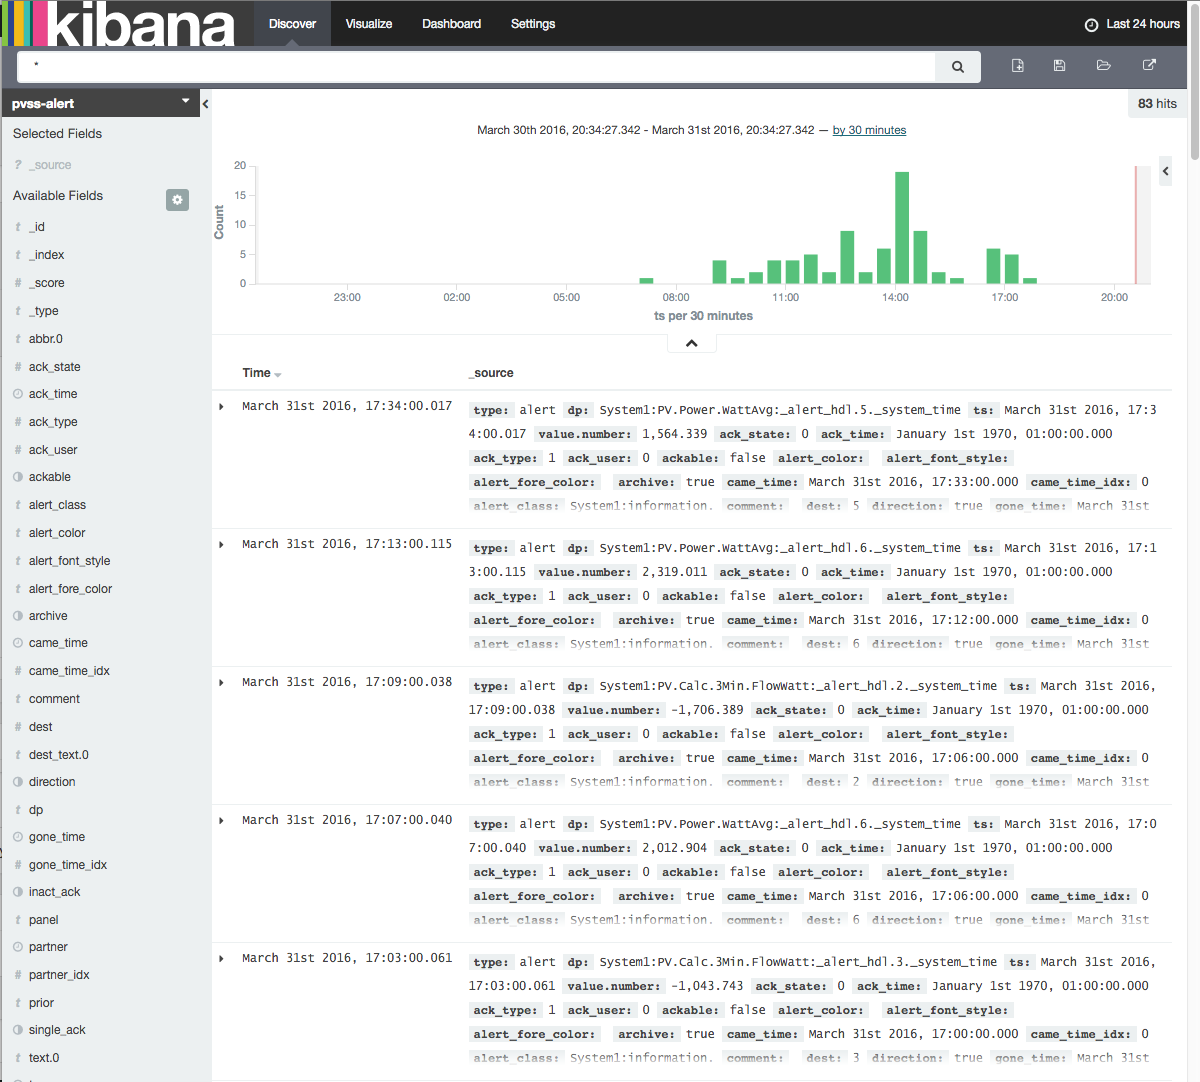
With a Java-Datalogger we can write events and alerts to different data sinks. For example we can use ElasticSearch and Kibana to discover alerts collected by WinCC OA. Elasticsearch provides full text search, analytics, dashboards. And now it also supports graphs!

“Graph introduces a new way to discover, and explore, the relationships that live in your data. Adding relevance to the process of exploration, a unique combination of graph and search means you can do things like detect fraud, recommend content, and more.”  https://www.elastic.co/de/products/graph

Kibana-Dashboard

Screen Shot 2016-03-31 at 20.48.52Screen Shot 2016-03-31 at 20.34.52

Hadoop OpenTSDB timeseries database and Grafana with WinCC OA…

Forwarding events from WinCC OA to OpenTSDB, which is based on HBase. Based on OpenTSDB Grafan can be used to build cool dashboards in a very fast way.

Live Example (my photovoltaic data) : http://82.149.127.81/grafana

On my test environment (i7 with 32gb RAM and 8 threads) i was able to push about 20000(!) values per second from my WinCC OA system to my Hadoop/HBase cluster. WinCC OA and the Hadoop Cluster are running on Hyper-V.

Grafana

How to use “server side database access” (sdb.ctl) for WinCC OA

The sdb.ctl is a client library which can be used to access relational databases from the WinCC OA client without the need to install any database client software at the client. The connection to the relational database is handled by the WinCC OA server. The client communicates with the WinCC OA server only by data points. The SQL-Statements are transferred by data points to a WinCC OA control, this control executes the SQL-Statements and sends back the result to the client by data points.

Howto: sdb

Downtime Query WinCC OA with RDB-Manager…

Example how to query the downtime of a device which has an alert configuration on the state of the machine (state 0/1):

select element_name, sum(downtime) downtime from (
select e.element_name,
h.ts,
h.VALUE_NUMBER,
h.direction,
case
when h.DIRECTION = 0 then
CAST((h.ts + 0) - ((lag(h.ts, 1, h.ts) OVER(ORDER BY ts)) + 0) AS FLOAT)*24*60*60
else
null
end as downtime
from elements e
join alerthistory h
on e.element_id = h.ELEMENT_ID
where e.element_name like
'Device_%.Status'
and ts between to_date('01.07.2014','DD.MM.YYYY') and to_date('31.07.2014','DD.MM.YYYY')
) group by element_name

Oracle 12c unified audit trail fills up SYSAUX tablespace (schema AUDSYS)


-- clean audit trail for the current container
BEGIN
DBMS_AUDIT_MGMT.CLEAN_AUDIT_TRAIL(
AUDIT_TRAIL_TYPE => DBMS_AUDIT_MGMT.AUDIT_TRAIL_UNIFIED,
USE_LAST_ARCH_TIMESTAMP => FALSE,
CONTAINER => DBMS_AUDIT_MGMT.CONTAINER_CURRENT );
END;

-- drop purge job
BEGIN
DBMS_AUDIT_MGMT.DROP_PURGE_JOB(
AUDIT_TRAIL_PURGE_NAME => 'Audit_Trail_PJ');
END;
/

-- create purge job for current container
BEGIN
DBMS_AUDIT_MGMT.CREATE_PURGE_JOB (
AUDIT_TRAIL_TYPE => DBMS_AUDIT_MGMT.AUDIT_TRAIL_UNIFIED,
AUDIT_TRAIL_PURGE_INTERVAL => 12,
AUDIT_TRAIL_PURGE_NAME => 'Audit_Trail_PJ',
USE_LAST_ARCH_TIMESTAMP => FALSE,
CONTAINER => DBMS_AUDIT_MGMT.CONTAINER_CURRENT);
END;
/
/