MQTT brokers handle retained messages differently – and that can have serious implications…
🔸 HiveMQ Community Edition doesn’t support to persist retained messages to disk. After a restart, they’re gone – so it’s better to go with the Enterprise Edition. Unfortunately I do not have access to the Enterprise version to perform further tests.
🔸 Mosquitto writes retained messages to disk periodically(!), default is 30 minutes! And during writing from memory to disk, publishing values pauses, it seems the broker gets frozen during writing to disk. Writing 1M retained messages to disk takes time… plus, I got it to crash at about 4460000 retained values (reproducible), and after the crash, it didn’t start anymore – until I removed the database file and lost all retained messages.
🔸 EMQX handled the test with a max of 2000 value changes per second. It was already using about 250% CPU of four cores, and I occasionally received “Mnesia is overloaded” warnings. I don’t know whether messages are being queued or dropped at that point. Writing to disk didn’t seem fast. Additionally, a broker startup after storing 1 million retained messages took a while (about 30 seconds), likely because all values are being loaded into memory.
🔸 BifroMQ handled the test at around 8000 v/s, using only about 20% of four CPU cores. I noticed that throughput decreases as the number of published topics increases. Interestingly, it limits wildcard subscriptions to just 10 retained messages – to protect the system, but that number feels a bit low. I couldn’t find a configuration setting to change it.
🔸 MonsterMQ handled the test with about 7000 v/s with 18% for the Monster plus 70% for the PostgreSQL database of four CPU cores. MonsterMQ stores retained messages in a PostgreSQL table (written in bulk). If you have a high volume of retained messages, it can lead to full queues – especially if your PostgreSQL instance can’t keep up. In that case, the broker will not persist all values.
🧨 Be careful when using retained messages!
👉 Understand and test your broker’s behavior before relying on them for data durability.
Just to note: These results are based on my own tests and specific use cases, and were performed on modest hardware. I was publishing retained messages to hierarchically structured topics (e.g., root/0/0/0/0/0/0/0/0/0/0), using numbers from 0 to 9, without any subscribers.
Capturing WinCC Unified Traces to Elasticsearch
In industrial automation, logging and monitoring are crucial for maintaining system health and troubleshooting issues. Siemens WinCC Unified provides built-in tracing capabilities that. In this post I will show how to capture that traces to Elasticsearch to allow seamless log collection, storage, and visualization.
Step 1: Capturing WinCC Unified Traces
WinCC Unified provides a trace tool that simplifies the process of collecting traces. The tool allows logs to be written to files, which can then be read by Logstash (a tool to process log files).
In that example we will write the log files to C:\Tools\logstash-siemens\logs directory.
"C:\Program Files\Siemens\Automation\WinCCUnified\bin\RTILtraceTool.exe" -mode logger -path C:\Tools\logstash-siemens\logs
Step 2: Collecting Logs with Logstash
Create a Logstash configuration file (e.g., C:\Tools\logstash-siemens\logstash.conf
input {
  file {
    path => "C:/Tools/logstash-siemens/logs/*.log"  # Use forward slashes for Windows paths
    start_position => "beginning"
    sincedb_path => "C:/Tools/logstash-siemens/sincedb"  # Save the reading state
    codec => plain {
      charset => "UTF-8"
    }
  }
}

filter {
  # Drop empty lines
  if [message] =~ /^\s*$/ {
    drop { }
  }

  # Add a custom field to identify the log source
  mutate {
    add_field => { "Source" => "WinCC Unified" }
  }

  # Use dissect to parse the log format correctly
  dissect {
    mapping => {
      "message" => "%{#}|%{Host}|%{System}|%{Application}|%{Subsystem}|%{Module}|%{Severity}|%{Flags}|%{Timestamp}|%{Process/Thread}|%{Message}"
    }
	  remove_field => ["message"]
  }

  # Remove leading and trailing spaces
  mutate {
    strip => ["#", "Host", "System", "Application", "Subsystem", "Module", "Severity", "Flags", "Timestamp", "Process/Thread"]
  }

  # Convert timestamp to @Timestamp (ensure it matches your log format)
  date {
    match => ["Timestamp", "yyyy.MM.dd HH:mm:ss.SSS"]
    target => "@timestamp"
    timezone => "UTC"
    locale => "en"  # Add locale to avoid parsing issues due to different formats or locales
  }
}

output {
  # stdout {
  #   codec => json_lines
  # }

  # Elasticsearch output (uncomment to enable)
  elasticsearch {
     hosts => ["http://linux0:9200"] # Change it to your Elasticsearch host
     index => "wincc-traces-%{+YYYY.MM}"
     # user => "elastic"
     # password => "elastic"
  }
}
Start Logstash to collect log files. First, download Logstash (https://www.elastic.co/downloads/logstash) and extract it to C:\Tools.
Then, run the following command to start Logstash using the specified configuration file:
C:\Tools\logstash-8.17.3\bin\logstash.bat -f C:\Tools\logstash-siemens\logstash.conf
Forwarding Traces from WinCC Unified Panels
For WinCC Unified Panels, trace forwarding can be enabled, allowing traces to be captured with the WinCC Unified trace tool on a PC. The traces will then be also be written to files on the same PC (by the tool you started at Step 1).
“C:\Program Files\Siemens\Automation\WinCCUnified\bin\RTILtraceTool.exe” -mode receiver -host
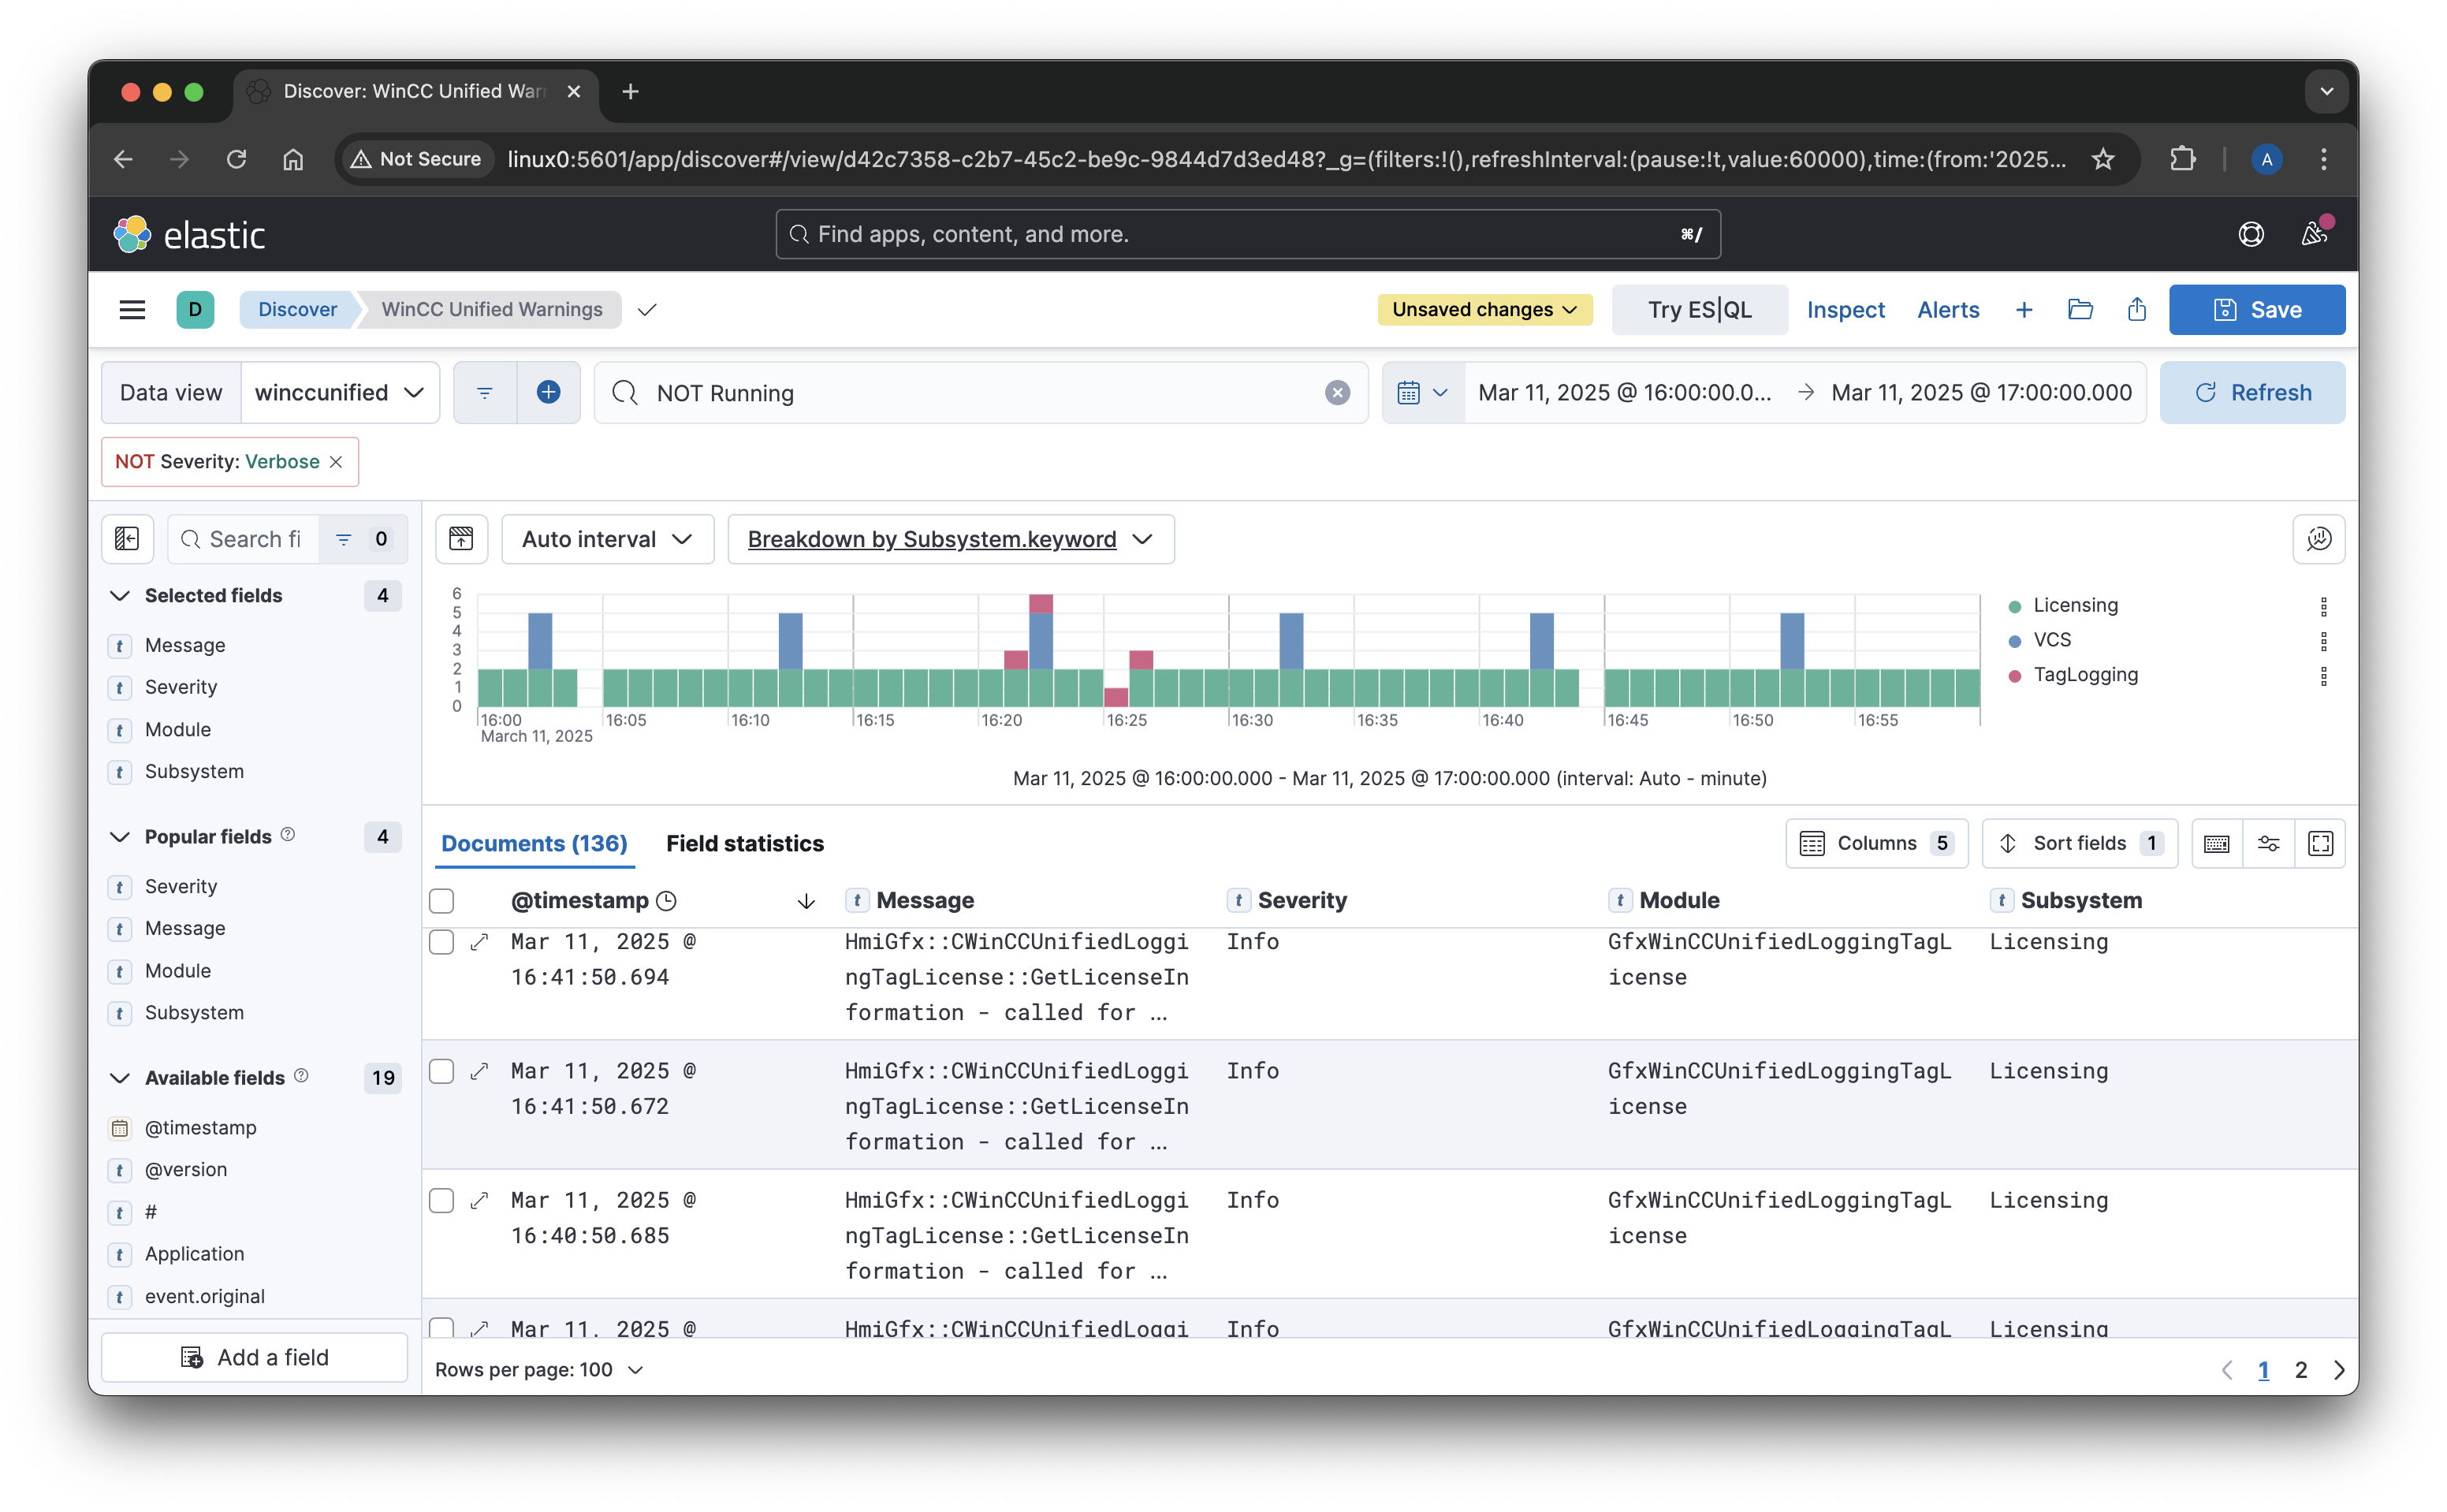
Step 4: Visualizing Logs in Kibana
Once logs are stored in Elasticsearch, Kibana provides a powerful interface to explore and analyze them.
- Open Kibana and navigate to Stack Management > Index Patterns.
- Create a new index pattern matching
wincc-traces-*. - Use Discover to explore logs and apply filters.
- Create dashboards and visualizations to monitor system health and performance.
WinCC Open Architecture Is Free to Try!
🧐 Lot of people think that WinCC software is not easy to access and try out – but that‘s not true: WinCC Open Architecture can be downloaded for free!
👉 All you need to do is register with your email, and you’ll get access to the software at no cost. You can explore and learn it without limitations. It runs for about 30 minutes before restarting – not ideal for production use, but absolutely perfect for learning, experimenting, or building a proof of concept for potential customers.
💪 For those unfamiliar with WinCC Open Architecture: it’s not only a full-fledged SCADA system – it’s also an IT/OT platform. True to its name, ‘Open Architecture,’ you can literally connect anything to it and extract everything from it in an open and flexible manner.
🖐️ It runs on devices as small as a Raspberry Pi, yet it can scale up to a distributed system, forming a unified cluster and providing a comprehensive view of all your business operations – whether it’s at the New York Underground or the largest machine humans have ever built: CERN.
Give it a try? www.winccoa.com
MQTT Bandwidth Efficiency: The Role of Topic Alias in MQTT 5 and Why I Only Got It Working with EMQX?
Recently, I conducted a test to analyze the bandwidth usage of MQTT, and one feature stood out as particularly impactful: the Topic Alias feature in MQTT 5. This feature can significantly reduce the overhead associated with long topic names, which is especially relevant in UNS (Unified Namespace) implementations using ISA-95-style topics, where topic names tend to be lengthy and sometimes consume more bytes than the payload itself.
💵 It can make an impact if you are being charged based on the amount of data transferred (cloud).
🚨 The Importance of Topic Alias
The Topic Alias feature allows a client to map a topic name to a shorter alias, reducing the amount of data transmitted. This can drastically lower bandwidth usage when transmitting messages with long topic names.
Using Topic Alias during publishing is straightforward but requires the topic-to-alias mapping logic to be implemented in the client program (which is not difficult to do).
On the subscriber side, the implementation should ideally be seamless. In theory, a subscriber needs only to set the maximum allowed alias number during the connection phase. This should make the feature easy to adopt for receiving applications.
👉 During my tests, I discovered something surprising: EMQX was the only broker (of the ones I have tested) to support Topic Alias for subscriptions(!) out of the box. With others I was unable to enable this functionality.
👉 To note: most articles about Topic Alias focus primarily on its use during publishing, not on subscriptions. I was focused on subscriptions.
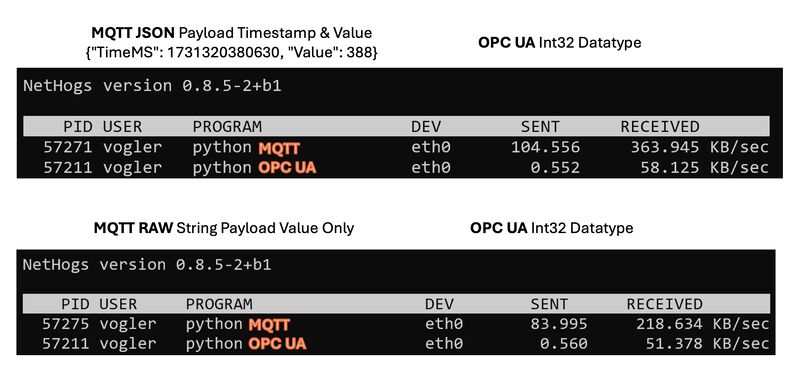
📊 MQTT vs. OPC UA: Bandwidth Usage – Unexpected Results!?
🤔 I often heared about claims that MQTT requires less bandwidth than OPC UA. In my own testing, I found the opposite to be true!
🧪 I took a tree of over 3,500 topics, changing every topic once a second and replicated the exact same structure in OPC UA. In MQTT I was using a simple JSON payload of TimeMS plus the Value (just to note: OPC UA transmits more information than that). I also tried a version with just the plain value as a string. Then, I compared the network I/O stats of client programs subscribing to all those tags, both for OPC UA and MQTT, and confirmed that both clients are receiving all values.
👉 MQTT didn’t show a bandwidth advantage – in fact, it used four to six times the bandwidth of OPC UA in this setup! See the results. 200 KB/s vs 50 KB/s
And, to be honest, it makes sense: every single value change in MQTT includes the full topic name (enterprise/site/area/cell/…), creating a high overhead compared to OPC UA.
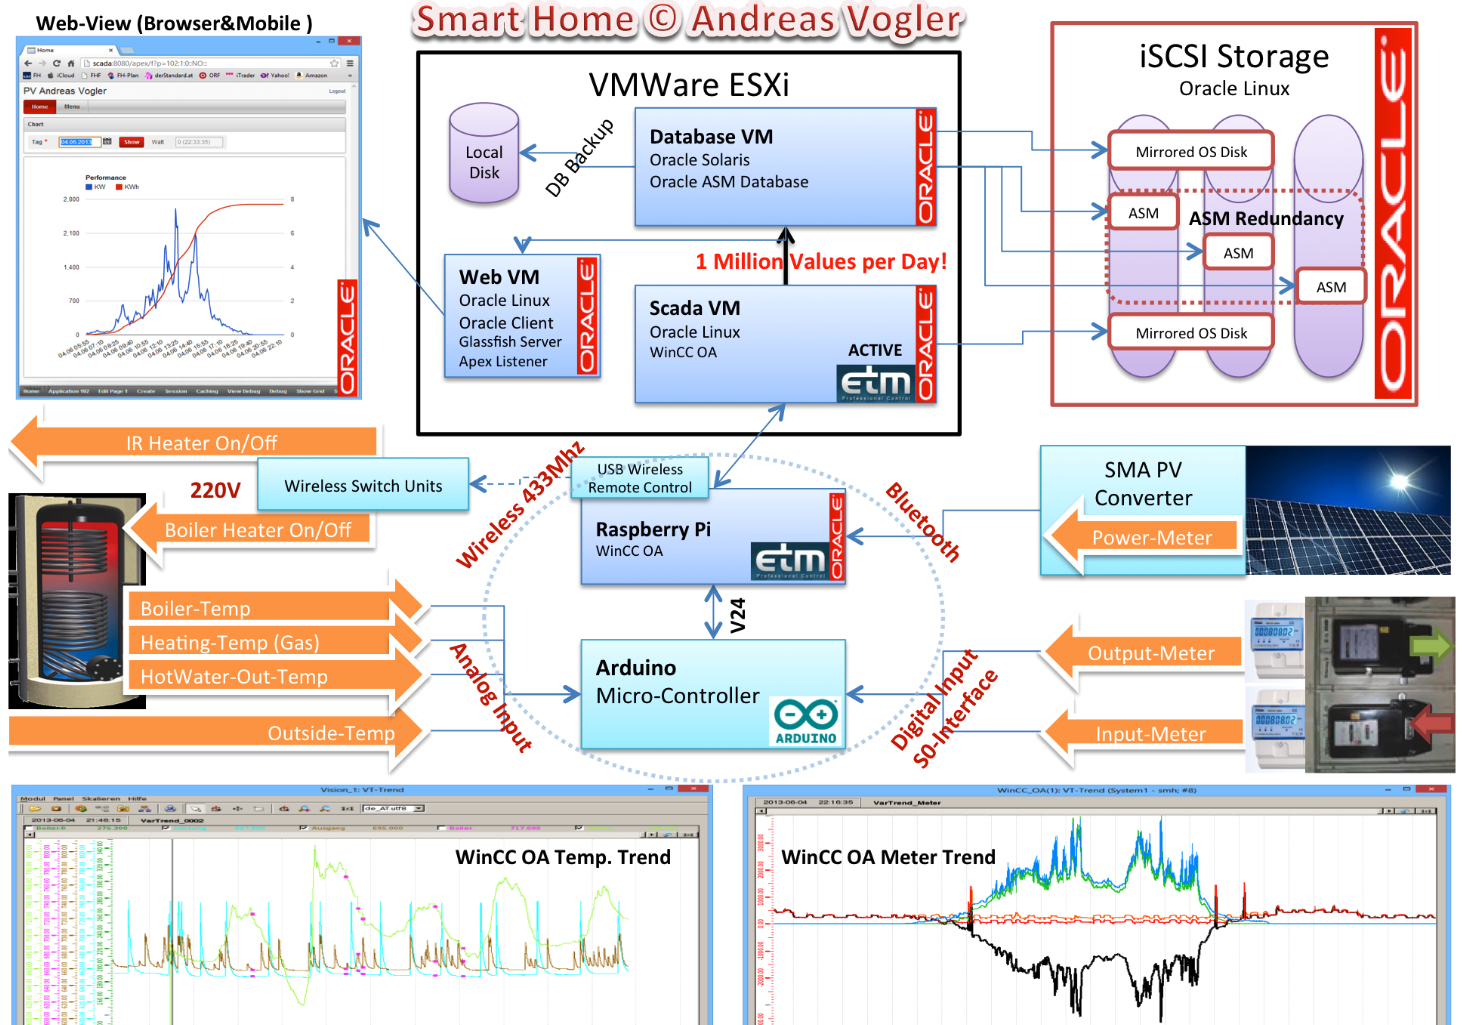
Bachelors Thesis from 2014: Optimizing the use of photovoltaic systems in single-family homes
Abstract
Within this thesis we implement a prototype of a smart home process control system for increasing the consumption of self-produced photovoltaic energy. To increase the consumption of self-produced energy, the energy is stored in a thermal storage by charging it automatically in case there is excess energy.
Due to the increasing popularity of small energy-producing plants (mainly photovoltaic systems) the allowances for energy fed into the public electricity grid decreases. The income from this kind of electricity is lower than the price of purchased electricity. By increasing the self-consumption of energy, the profitability of a photovoltaic system can be significantly improved.
Based on the findings of the thesis 1 „Eigenverbrauchsoptimierung vonPhotovoltaikstrom in Einfamilienhäusern“ (Vogler, 2014), the components to build such an integrated control system are implemented. The goal is to build an automated control system, that enforces power consumption when there is enough self-produced electricity available.
Due to long product cycles, companies in the process control-business are comparatively innovation averse and expensive. But with systems such as Arduino or Raspberry Pi, which allow an easy entry to the embedded programming and control technology, an intelligent control system for self-consumption of photovoltaic electricity by thermal storage can be implemented with low cost.
Our system consists of loosely coupled separated components. By the use of service interfaces, the components are highly distributed, which follows the current IT trend of ” IoT – Internet of Things “.
Thesis 1: Optimizing self-consumption of photovoltaic electricity in single-family homes
Thesis 2: Optimizing the use of photovoltaic systems in single-family homes
Replicate and Archive Data from a MQTT Broker to MonsterMQ
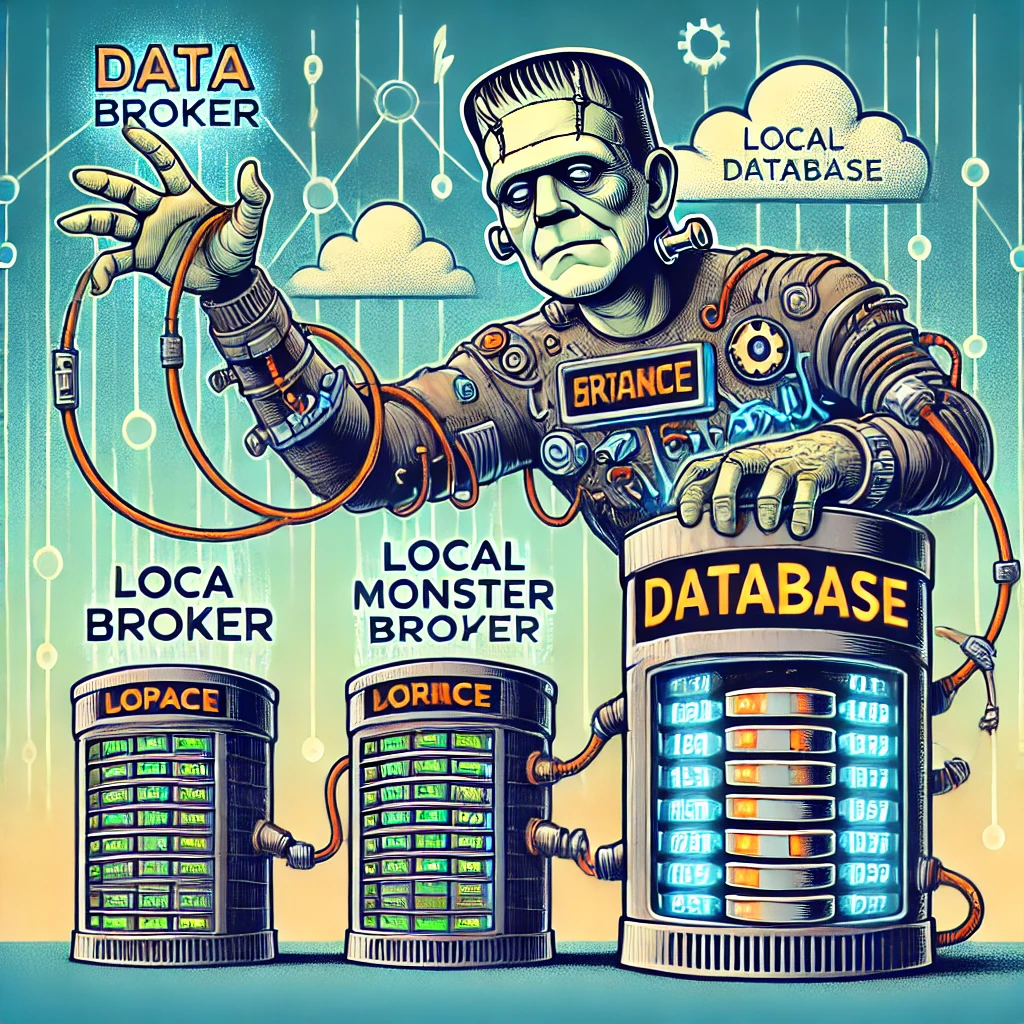
Here’s a straightforward example of how data replication can be achieved using the Frankenstein Automation-Gateway.com to transfer data from a remote broker to a local MonsterMQ Broker.
The local MonsterMQ Broker is configured so that data is stored in TimescaleDB to maintain a historical record. This process converts the current state of the UNS into archived historical data.
It will also create a Frankenstein OPC UA Server, allowing you to access the data from the MQTT broker. However, since we have it data-agnostic, all the data in the OPC UA Server will be available as a string data type.
Monster.yaml
Create a file monster.yaml with this content :
TCP: 1883
WS: 1884
SSL: false
MaxMessageSizeKb: 64
QueuedMessagesEnabled: false

SessionStoreType: POSTGRES
RetainedStoreType: POSTGRES

ArchiveGroups:
  - Name: "source"
    Enabled: true
    TopicFilter: [ "source/#" ]
    RetainedOnly: false
    LastValType: NONE
    ArchiveType: POSTGRES

Postgres:
  Url: jdbc:postgresql://timescale:5432/postgres
  User: system
  Pass: manager
Frankenstein.yaml
Create a file frankenstein.yml with this content and adapt the Host of the soruce broker and the Topic paths which you want to replicate from the source to your local MonsterMQ Broker.
Servers:
  OpcUa:
    - Id: "opcsrv"
      Port: 4840
      EndpointAddresses:
        - linux0 # Change this to your hostname!
      Topics:
        - Topic: mqtt/source/path/Enterprise/Dallas/#
Drivers:
  Mqtt:
    - Id: "source"
      Enabled: true
      LogLevel: INFO
      Host: test.monstermq.com # Change this to your source MQTT Broker!
      Port: 1883
      Format: Raw
Loggers:
  Mqtt:
    - Id: "source"
      Enabled: true
      LogLevel: INFO
      Host: 172.17.0.1
      Port: 1883
      Format: Raw
      BulkMessages: false
      LogLevel: INFO
      Logging:
        - Topic: mqtt/source/path/Enterprise/Dallas/#
Docker Compose
Create a docker-compose.yaml file with this content and then start it with docker-compose up -d
services:
  timescale:
    image: timescale/timescaledb:latest-pg16
    container_name: timescale
    restart: unless-stopped
    ports:
      - "5432:5432"
    volumes:
      - timescale_data:/var/lib/postgresql/data
    environment:
      POSTGRES_USER: system
      POSTGRES_PASSWORD: manager
  monstermq:
    image: rocworks/monstermq:latest
    container_name: monstermq
    restart: unless-stopped
    ports:
      - 1883:1883
      - 1884:1884
    volumes:
      - ./log:/app/log
      - ./monster.yaml:/app/config.yaml
    command: ["+cluster", "-log FINE"]
  frankenstein:
    image: rocworks/automation-gateway:1.37.1
    container_name: frankenstein
    restart: always
    ports:
      - 1885:1883
      - 4840:4840
    environment:
      JAVA_OPTS: '-Xmx1024m'
    volumes:
      - ./frankenstein.yaml:/app/config.yaml
      - ./security:/app/security
volumes:
timescale_data: From OPC UA & MQTT/SparkplugB to Snowflake with Frankenstein Automation-Gateway
In that example we take SparkplugB messages from a MQTT Broker, decode it and write it to Snowflake. And we take some OPC UA nodes and write it also to the same table.
Create a database and a schema for your destination table.
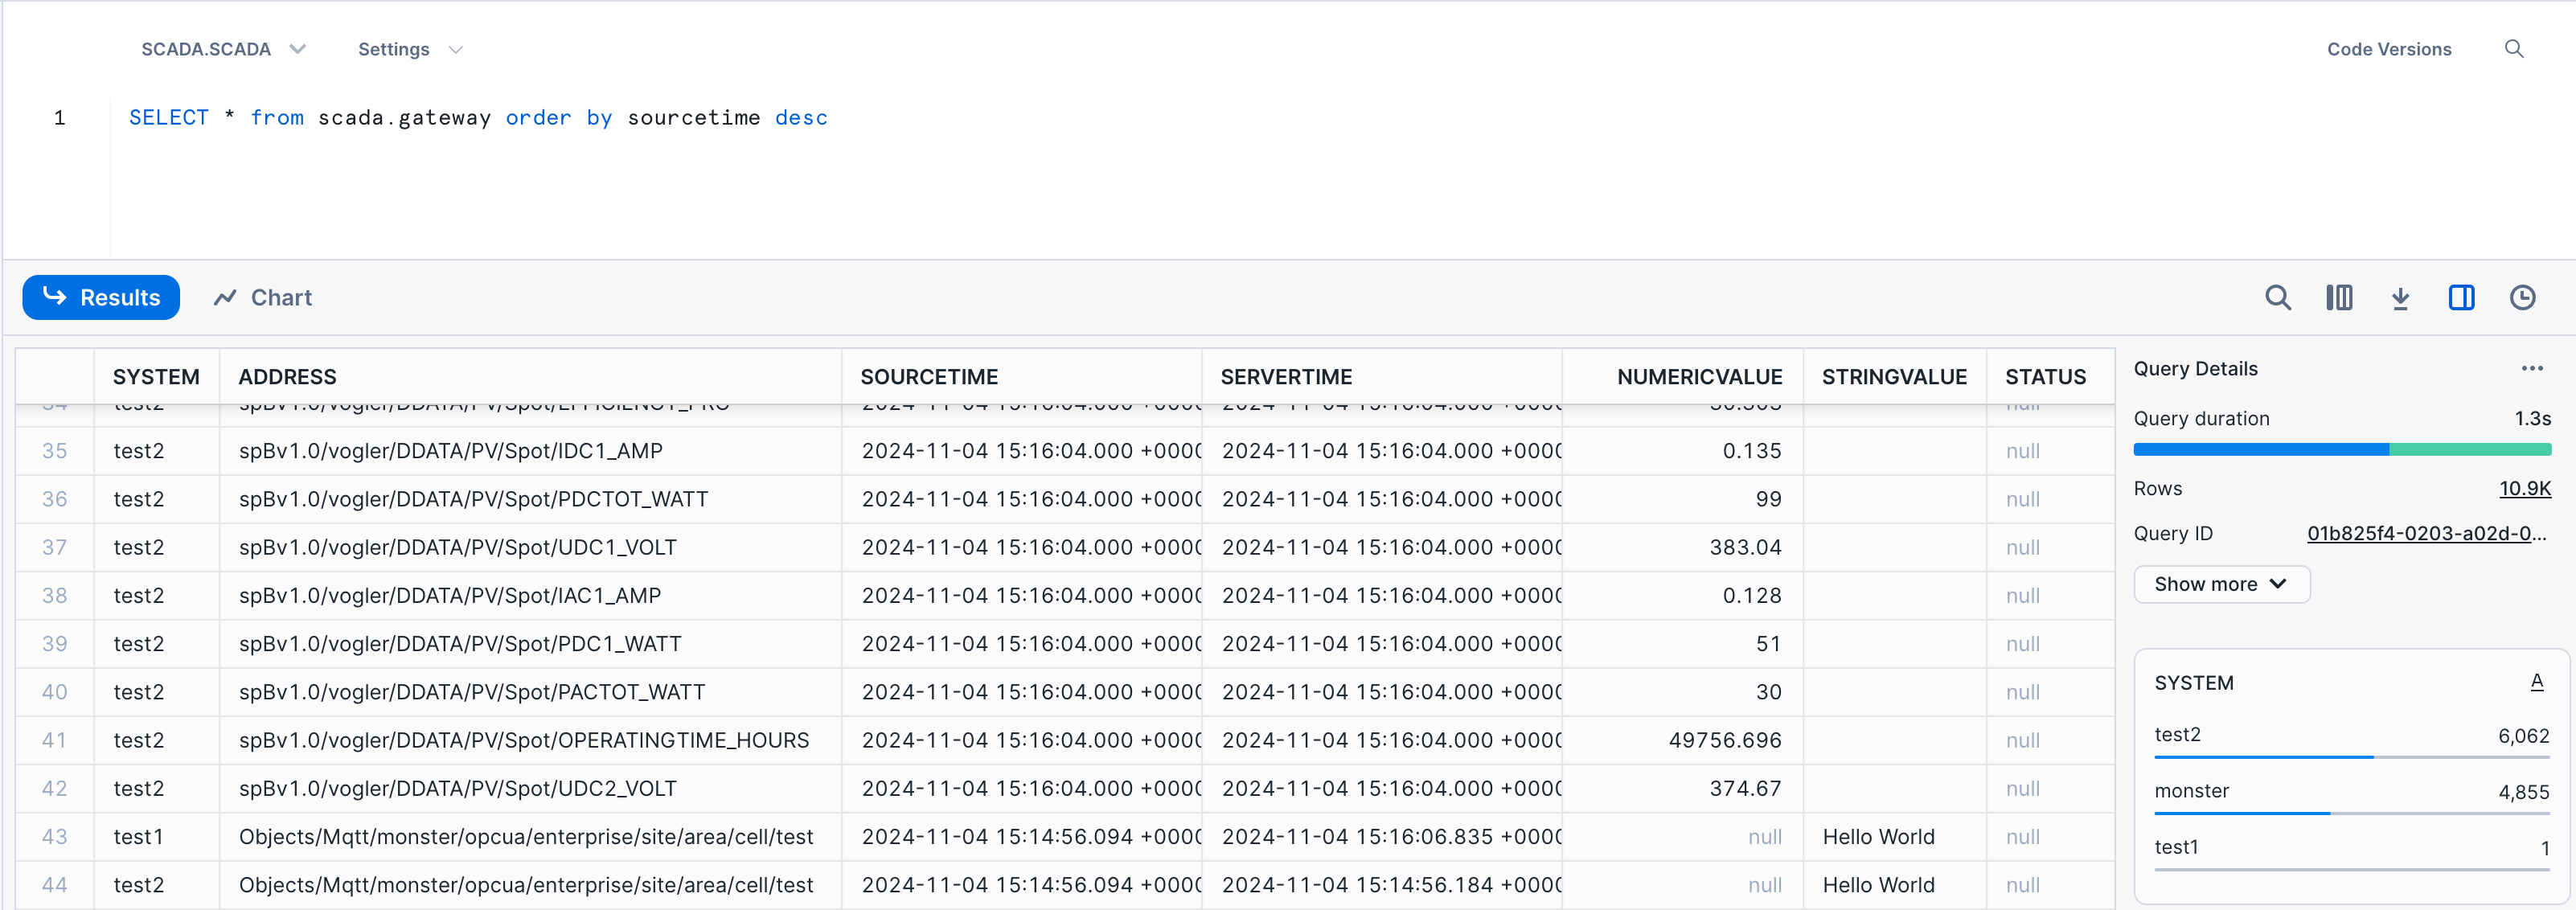
CREATE OR REPLACE SCHEMA scada;Create the table for the incoming data:
CREATE TABLE IF NOT EXISTS scada.gateway (
  system character varying(1000) NOT NULL,
  address character varying(1000) NOT NULL,
  sourcetime timestamp with time zone NOT NULL,
  servertime timestamp with time zone NOT NULL,
  numericvalue float,
  stringvalue text,
  status character varying(30),
  CONSTRAINT gateway_pk PRIMARY KEY (system, address, sourcetime)
  );
Generate a private key:
> openssl genrsa 2048 | openssl pkcs8 -topk8 -v2 des3 -inform PEM -out snowflake.p8 -nocrypt
Generate a public key:
> openssl rsa -in snowflake.p8 -pubout -out snowflake.pub
Set the public key to your user:
> ALTER USER xxxxxx SET RSA_PUBLIC_KEY=’MIIBIjANBgkqh…’;
Replace MIIBIjANBgkqh… with your public key from the snowflake.pub file (without —–BEGIN PRIVATE KEY—– and without —–END PRIVATE KEY—–)
Details about creating keys can be found here
Prepare the Gateway
Add a Snowflake logger section to the gateways config.yml. In that example we take SparkplugB messages from a MQTT Broker, decode it and write it to Snowflake. And we take some OPC UA nodes and write it also to the same table.
Drivers:
OpcUa:
- Id: "test1"
Enabled: true
LogLevel: INFO
EndpointUrl: "opc.tcp://test.monstermq.com:4840/server"
UpdateEndpointUrl: true
SecurityPolicy: None
Mqtt:
- Id: "test2"
Enabled: true
LogLevel: INFO
Host: test.monstermq.com
Port: 1883
Format: SparkplugB
Loggers:
Snowflake:
- Id: "snowflake"
Enabled: true
LogLevel: INFO
PrivateKeyFile: "snowflake.p8"
Account: xx00000
Url: https://xx00000.eu-central-1.snowflakecomputing.com:443
User: xxxxxx
Role: accountadmin
Scheme: https
Port: 443
Database: SCADA
Schema: SCADA
Table: GATEWAY
Logging:
- Topic: opc/test1/path/Objects/Mqtt/#
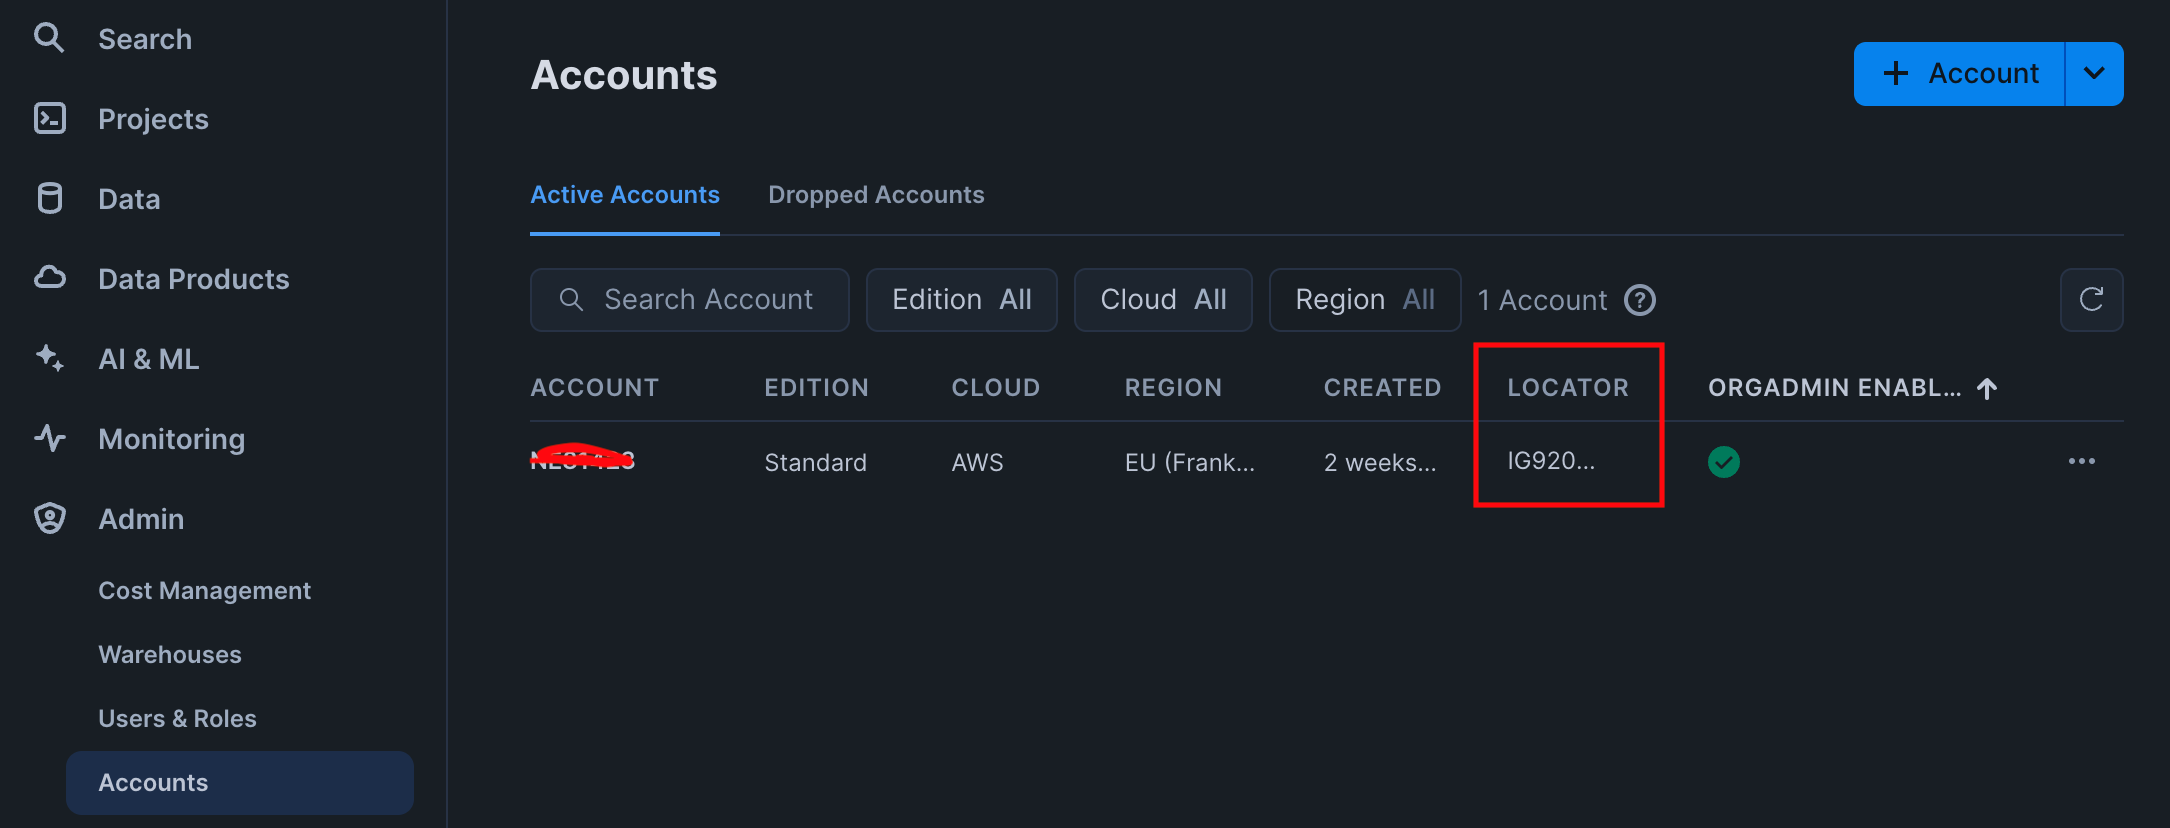
- Topic: mqtt/test2/path/spBv1.0/vogler/DDATA/+/#The Url you can find in the Snowflake web console by going to Admin/Accounts and then hover over the “Locator” column.
Start the Gateway
> git checkout snowflake
> cd automation-gateway/source/app
> ../gradlew run
Note: Using gradlew to start the gateway is not recommended for production. Instead, consider using a Docker image or the files from the build/distribution for a more robust setup..
Exploring My Home Automation Architecture
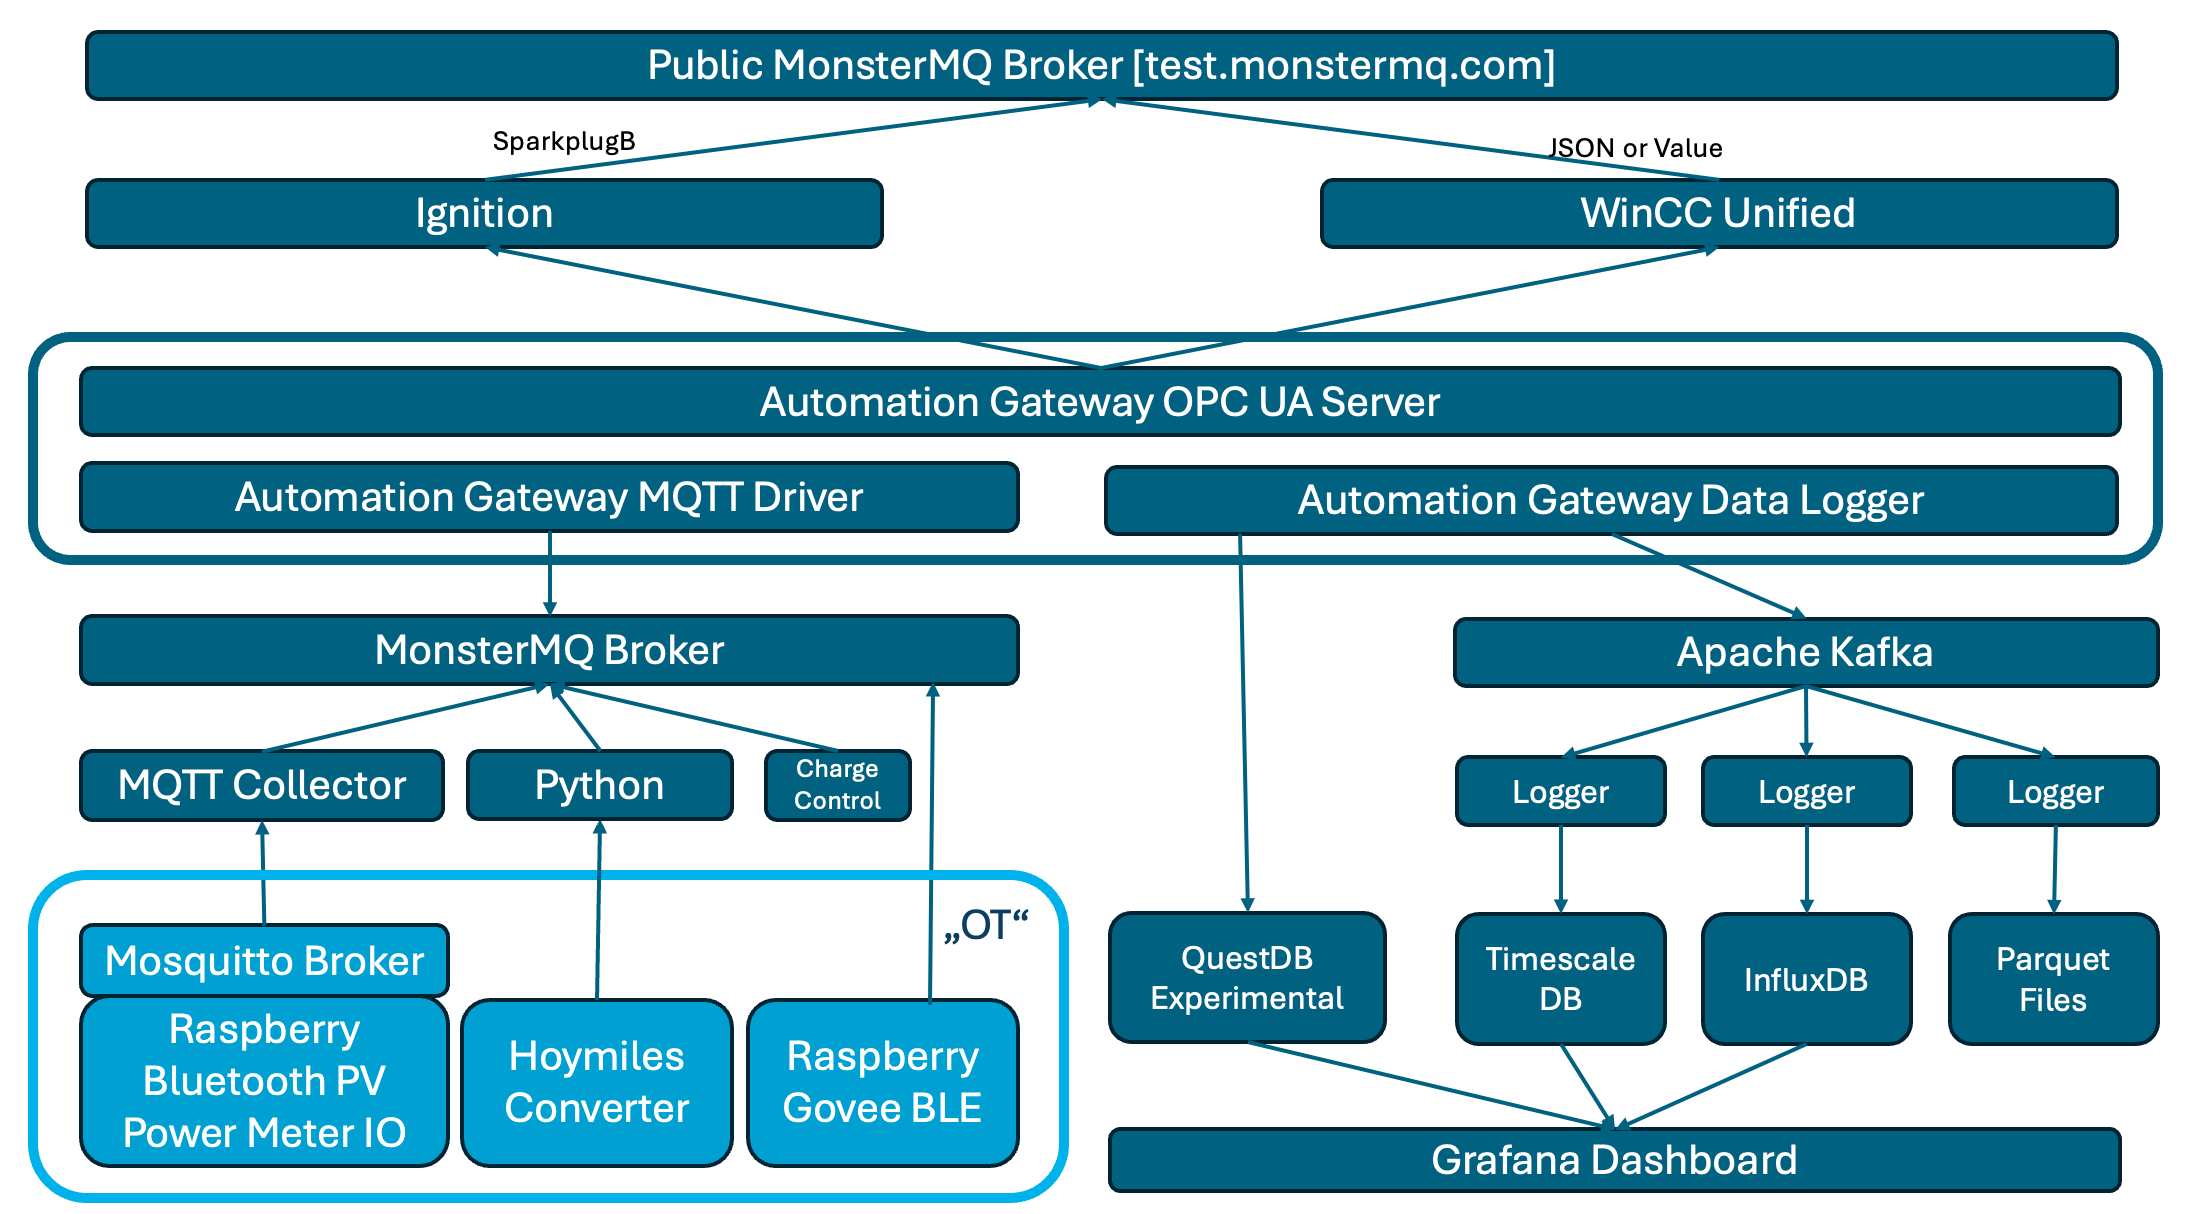
My home automation setup has been an ongoing project, evolving over the last 10–15 years. It started with a simple goal: to track data from my photovoltaic (PV) system, power meters, and temperature sensors, all connected through Raspberry Pi devices. It started with Oracle and over time, it’s grown into a more complex architecture that incorporates multiple layers of data collection, processing, and visualization.
1. Data Collection with Raspberry Pi and MQTT
At the core of my setup are Raspberry Pi devices that connect various sensors, including those for monitoring power generation (PV) by bluetooth, power consumption by meters giving digital signals, and temperature sensors. These Pi devices act as data collectors, feeding data into a local Mosquitto broker. A local broker on the device can serve as a short-term buffer, before it’s synchronized to my central MonsterMQ broker, by using a persistant session and QoS>0.
2. MonsterMQ Broker as the Central Hub
The MonsterMQ broker is the central point where data from all sources is collected. It serves as a bridge, collecting data from the local Mosquitto broker and preparing it for further processing and storage. Before building my own broker, MonsterMQ, I used Mosquitto. Now that I have my own broker, I use MonsterMQ, both to ensure it gets thoroughly tested and to leverage its features. Additionally, in the future, I can use MonsterMQ to store incoming values directly in Apache Kafka. As a database engineer, I appreciate MonsterMQ because it allows me to view the broker’s current state by querying a PostgreSQL database. This lets me see connected clients, their connection details, source IP addresses, and all subscriptions with their parameters..
3. Automation-Gateway for Data Flexibility
To expand the possibilities of what I can do with the data, I use the Automation-Gateway. This tool collects values from MonsterMQ and serves two primary functions:
- Integration with Apache Kafka: By publishing data to Apache Kafka, I maintain a reliable stream that acts as an intermediary between my data sources and the storage databases. This setup provides resilience, allowing me to manage and maintain the databases independently while keeping the data history intact in Kafka.
- OPC UA Server Exposure: The Automation-Gateway also exposes data as an OPC UA server, making it accessible to industrial platforms and clients that communicate over OPC UA. This can be achieved just with a simple YAML configuration file.
4. Experimental Integrations: Ignition and WinCC Unified
On top of this setup, I’ve added experimental connections to Ignition and WinCC Unified. Both of these platforms connect to the Automation-Gateway OPC UA Server. Just for testing those systems are publishing values to my public MQTT broker at test.monstermq.com. While these integrations aren’t necessary, they’re helpful for testing and exploring new capabilities.
5. Long-Term Data Storage with TimescaleDB, QuestDB, and InfluxDB
Data from Kafka is stored in multiple databases:
- InfluxDB: My home-automation started with Oracle and then moved to InfluxDB
- TimescaleDB: Since I am still an advanced SQL user, I needed a database with strong SQL capabilities. Therefore, I added TimescaleDB and imported historical data into it.
Amount of records as of today: 1_773_659_197
Additinally the Automation-Gateway is writing the data now to QuestDB. It is used for experimental data logging and alternative time-series database exploration. Potentially will replace the other databases. I was blown away by how quickly I was able to import 1.5 billion historical data points into QuestDB.
These databases serve as long-term storage solutions, allowing me to create detailed dashboards in Grafana. By keeping Kafka as the layer between my data sources and the databases, I ensure flexibility for database maintenance, as Kafka retains the historical data.
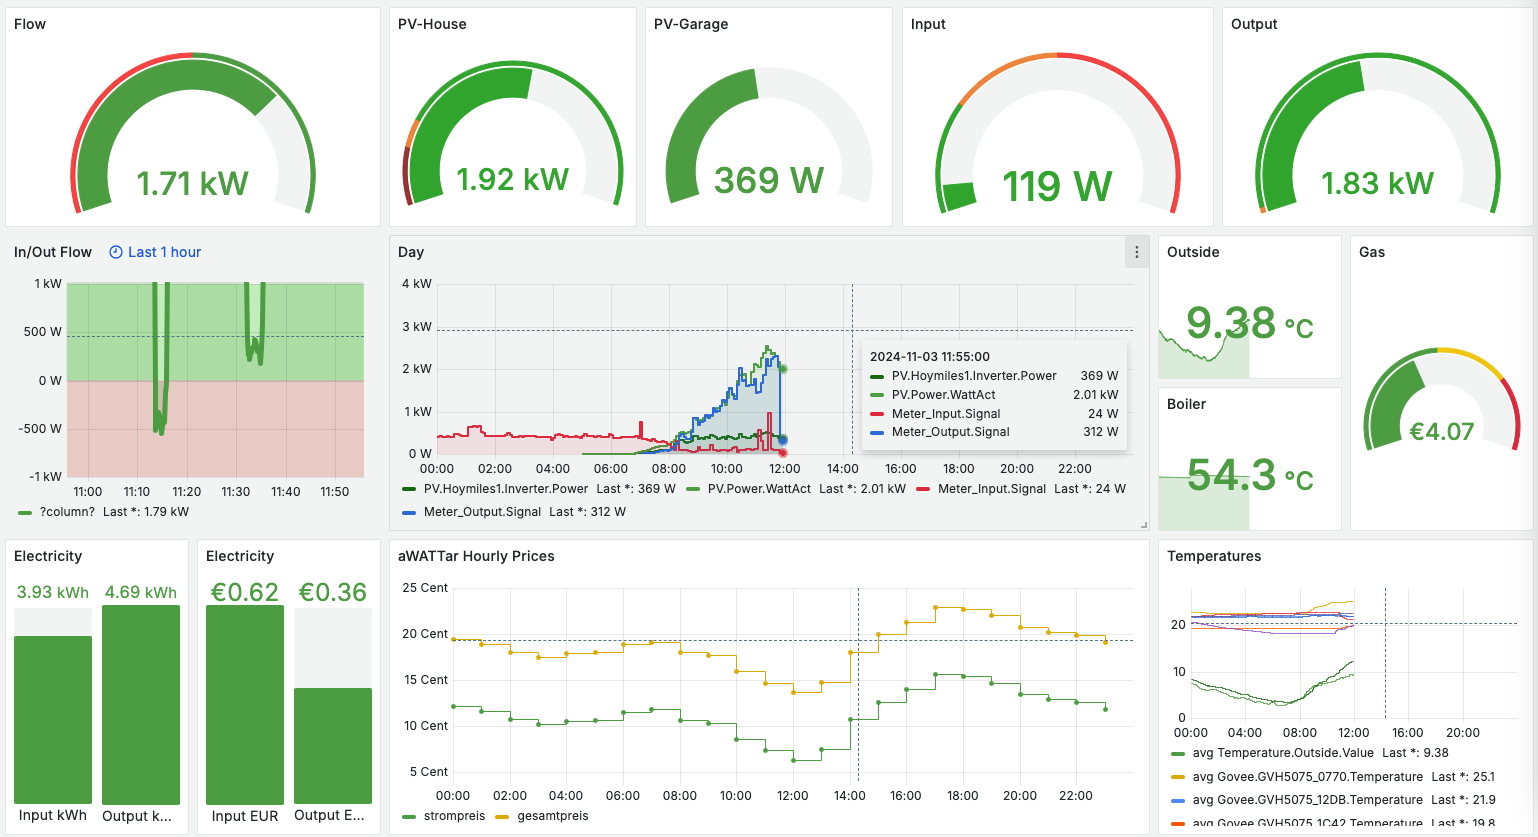
6. Data Logging with MonsterMQ
The public MonsterMQ broker is configured to write data of topics below “grafana/#” directly into a TimescaleDB table. This setup allows you to see updates in Grafana whenever new data is published. In this specific Grafana dashboard configuration, if you publish a JSON object with a key ‘value’ and a numeric value, such as {“value”: 42}, it will appear on the dashboard almost instantly. Here is a public dashboard.
select
time, array_to_string(topic,'/') as topic,
(payload_json->>'value')::numeric as value
from grafanaarchive
where $__timeFilter(time)
and payload_json->>'value' is not null
and payload_json->>'value' ~ '^[0-9]+(\.[0-9]+)?$'
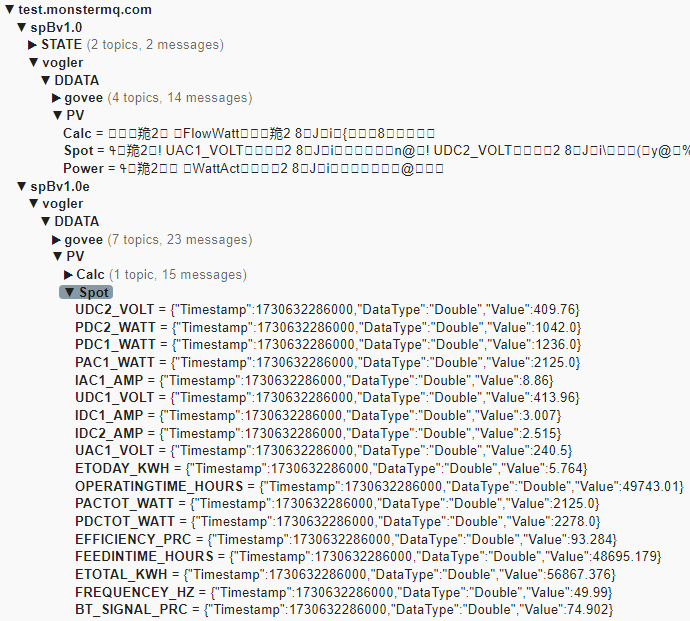
order by time asc7. SparkplugB Decoding with MonsterMQ
The public MonsterMQ broker is configured to decode and expand SparkplugB messages. Expanded messages can be found under the topic “spBv1.0e“. Ignition publishes some of my home automation data via SparkplugB to the public broker, and you’re welcome to publish your own SparkplugB messages here as well.
Final Thoughts
This setup is the result of years of experimentation and adaptation to new tools. In theory, I could simplify parts of it, for example, by replacing more components with the Automation-Gateway. But I appreciate having Kafka as the buffer between data sources and databases – it offers flexibility for maintenance and helps preserve historical data.
Feel free to test the public MonsterMQ broker at test.monstermq.com. And if you’re curious, publish a JSON object with a “value” key to grafana/something to see it immediately reflected in the Grafana dashboard!
MonsterMQ with Grafana
Because MonsterMQ can store topic values directly in PostgreSQL/Timescale, you can instantly create dashboards with Grafana! 📊
Here’s a simple example:
👉 Check out the live dashboard
It’s super easy to get started. Use the public available MonsterMQ at test.monstermq.com at port 1883. Just publish a JSON string to any topic under “Test”, like “Test/Sensor1” with a payload like this: {“value”: 1}, and you’ll see the value reflected in the Grafana dashboard in real time.
I’m currently publishing temperature sensor values to the public broker from my home automation using automation-gateway.com. Just that you see some values in the dashboard.
So, if you need a broker to store your IoT data directly into TimescaleDB without the need for any additional components, consider using MonsterMQ. It’s free and available at MonsterMQ.com.
Here is the exmaple docker-compose.yml file of the public availble test.monstermq.com broker:
services:
  timescale:
    image: timescale/timescaledb:latest-pg16
    restart: unless-stopped
    ports:
      - "5432:5432"
    volumes:
      - /data/timescale:/var/lib/postgresql/data
    environment:
      POSTGRES_USER: system
      POSTGRES_PASSWORD: xxx
  monstermq:
    image: rocworks/monstermq:latest
    restart: unless-stopped
    ports:
      - 1883:1883
    volumes:
      - ./config.yaml:/app/config.yaml
    command: ["+cluster", "-log INFO"]
  pgadmin:
    image: dpage/pgadmin4
    restart: unless-stopped
    environment:
      PGADMIN_DEFAULT_EMAIL: andreas.vogler@rocworks.at
      PGADMIN_DEFAULT_PASSWORD: xxx
    volumes:
      - /data/pgadmin:/var/lib/pgadmin/storage
    ports:
      - "8080:80"
  grafana:
    image: grafana/grafana
    restart: unless-stopped
    ports:
    - 80:3000
Here is the MonsterMQ config.yml file:
Port: 1883
SSL: false
WS: true
TCP: true

SessionStoreType: POSTGRES
RetainedStoreType: POSTGRES

SparkplugMetricExpansion:
  Enabled: true

ArchiveGroups:
  - Name: "All"
    Enabled: true
    TopicFilter: [ "#" ]
    RetainedOnly: false
    LastValType: POSTGRES
    ArchiveType: NONE
  - Name: "Test"
    Enabled: true
    TopicFilter: [ "Test/#" ]
    RetainedOnly: false
    LastValType: NONE
    ArchiveType: POSTGRES

Postgres:
  Url: jdbc:postgresql://timescale:5432/monster
  User: system
  Pass: xxx
Give it a try and let me know what you think!
#iot #mqtt #monstermq #timescale #postgresql #grafana