Category Archives: BigData/NoSQL

Streaming & Complex Event Processing (CEP) & EPL/CQL with WinCC OA…

Complex Event Processing (CEP) and event series analysis are used for detecting situations among events. EsperTech provides the Event Processing Language (EPL) designed for concisely expressing situations and fast execution against both historical and currently-arriving events (Espertech.com).

The Esper EPL is quite powerful – details can be found in the Esper documentation. Found also some slides about Esper. The EPL is a CQL (continuous query language), after a statement is created it is running coninously and results are streamed to listeners – in this prototype a listener is sending the results back to WinCC OA datapoints.

A WinCCOA API-Frontend-Manager gathers all value changes from WinCC OA and publishes it by ZeroMQ. The WinCC OA CEP Manager, with the open source Esper-Engine, subscribes to the Frontend-Manager to get the value changes. The advantage is that many subscribers can be connected to the Frontend-Manager, without increasing the load on the WinCC OA system (based on the ideas from CERN).

With the WinCC OA CEP Manager we can define EPL / CQL statements in WinCC OA and the result streams are passed back to WinCC OA on datapoints, where the results can be processed further.

Some simple EPL examples:

Calculate 5 minute average values with intermediate results every 1 minute:

select avg(value), min(value), max(value) 
from event(tag='System1:Meter_Input.Watt').win:time(5 min) 
output snapshot at (*/1, *, *, *, *)

With pattern matching complex event sequences can be observed with EPL. A simple example is: detect if datapoint B is set after datapoint A (A->B), and its value is higher than the value of A.

select a.value, b.value
from pattern [a=Event(tag='System1:Analog1.Input') -> every b=Event(tag='System1:ExampleDP_Trend1.' and b.value>a.value)]

Get a notification when a datapoint is changing more than 100 times within 10 seconds:

select tag, count(value) 
from Event.win:time_batch(10 sec) 
group by tag having count(*) > 100

Get a notification when a datapoint changes and there is no following value change within the next 10 seconds. For example: if meters are normally changing every 5 seconds, possible broken meters/interfaces can be detected with EPL:

select a.tag, count(*) from pattern 
[every a=Event -> (timer:interval(10 sec) and not Event(tag=a.tag))] 
group by a.tag

Other examples can be found here.

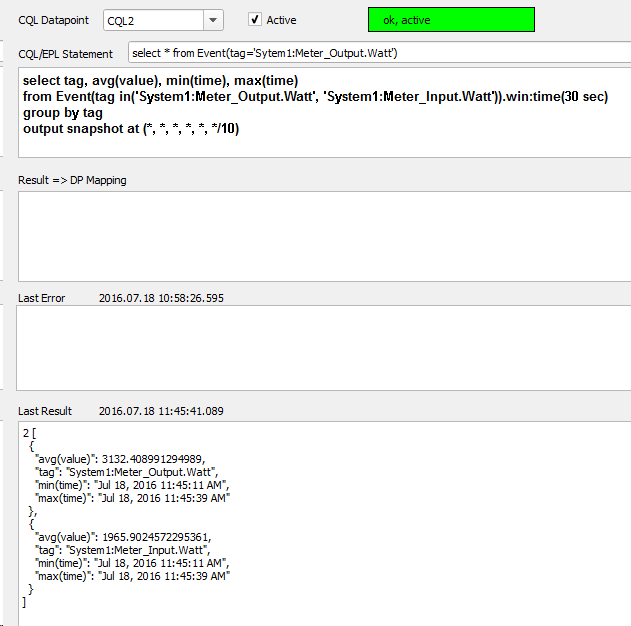
Attached is a screenshot of a simple panel where EPL statements can be defined and observed.

WinCCOA CEP Panel

Other examples for CEP with Esper: http://www.adrianmilne.com/complex-event-processing-made-easy/

Streaming WinCC OA Events to Apache Kafka and Spark…

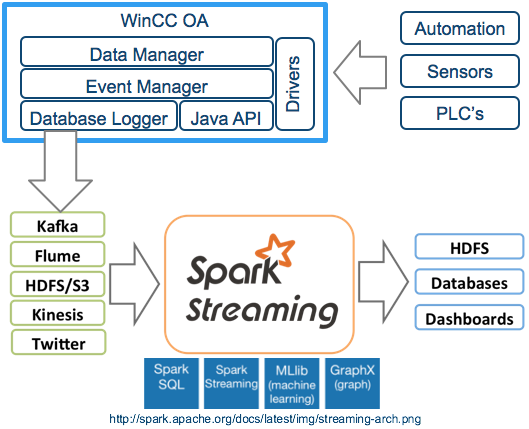
We connected a Event Data Logger, written in Java and connected to WinCC OA by JNI, to Apache Kafka, a A high-throughput distributed messaging system.

Apache Spark can read data from Apache Kafka streams. Apache Spark is a fast and general engine for large-scale data processing. Combine SQL, streaming, and complex analytics. Spark powers a stack of libraries including SQL and DataFrames, MLlib for machine learning, GraphX, and Spark Streaming. You can combine these libraries seamlessly in the same application.

WinCCOA-Kafka-Spark

Java is everywhere… WinCC OA Java Manager…

From laptops to datacenters, game consoles to scientific supercomputers, cell phones to the Internet, Java is everywhere! Now connected to WinCC OA.

Here you will find an implementation of an API to connect WinCC OA to Java. It is based on the WinCC OA native API and JNI. This version is for WinCC OA 3.14 on Windows. Same works on Linux, but is not in the Zip, if you want it for Linux, just send me an email.

An example for a dpSet in Java see blow, more examples are in the zip/source directory. The JClient class is an easy to use static class. It should be thread safe and callback functions are processed in a separate thread, so that the main WinCC OA thread/loop will not be blocked by callback functions.

Based on that a NoSQL database logger was created, it is able to handle up to 40000-50000 value changes by dpQueryConnect. MQTT was connected to WinCC OA with a few lines of code (see WinCC OA and MQTT).

Download from GitHub: https://github.com/vogler75/oa4j.git

How to use/install? In the zip is a ReadMe.txt with a step by step instruction.

JManager m = new JManager();
m.init(args).start(); 
ret = JClient.dpSet()
 .add("System1:ExampleDP_Trend1.:_original.._value", new FloatVar(Math.random()))
 .add("System1:ExampleDP_SumAlert.:_original.._value", new TextVar("hello world"))
 .await()
 .getRetCode();
Debug.out.log(Level.INFO, "retCode={0}", ret); 
m.stop();

WCCOAjava

Internet of Things (IoT) and WinCC OA with MQTT …

Recently i implemented a JAVA API for WinCC Open Architecture. So, it is possible to implement WinCC OA API Manager in Java. I used this to implement a simple API Manager in Java to connect WinCC OA to MQTT.

MQTT is a machine-to-machine (M2M) “Internet of Things” connectivity protocol. It was designed as an extremely lightweight publish/subscribe messaging transport. It is useful for connections with remote locations where a small code footprint is required and/or network bandwidth is at a premium (http://mqtt.org/).

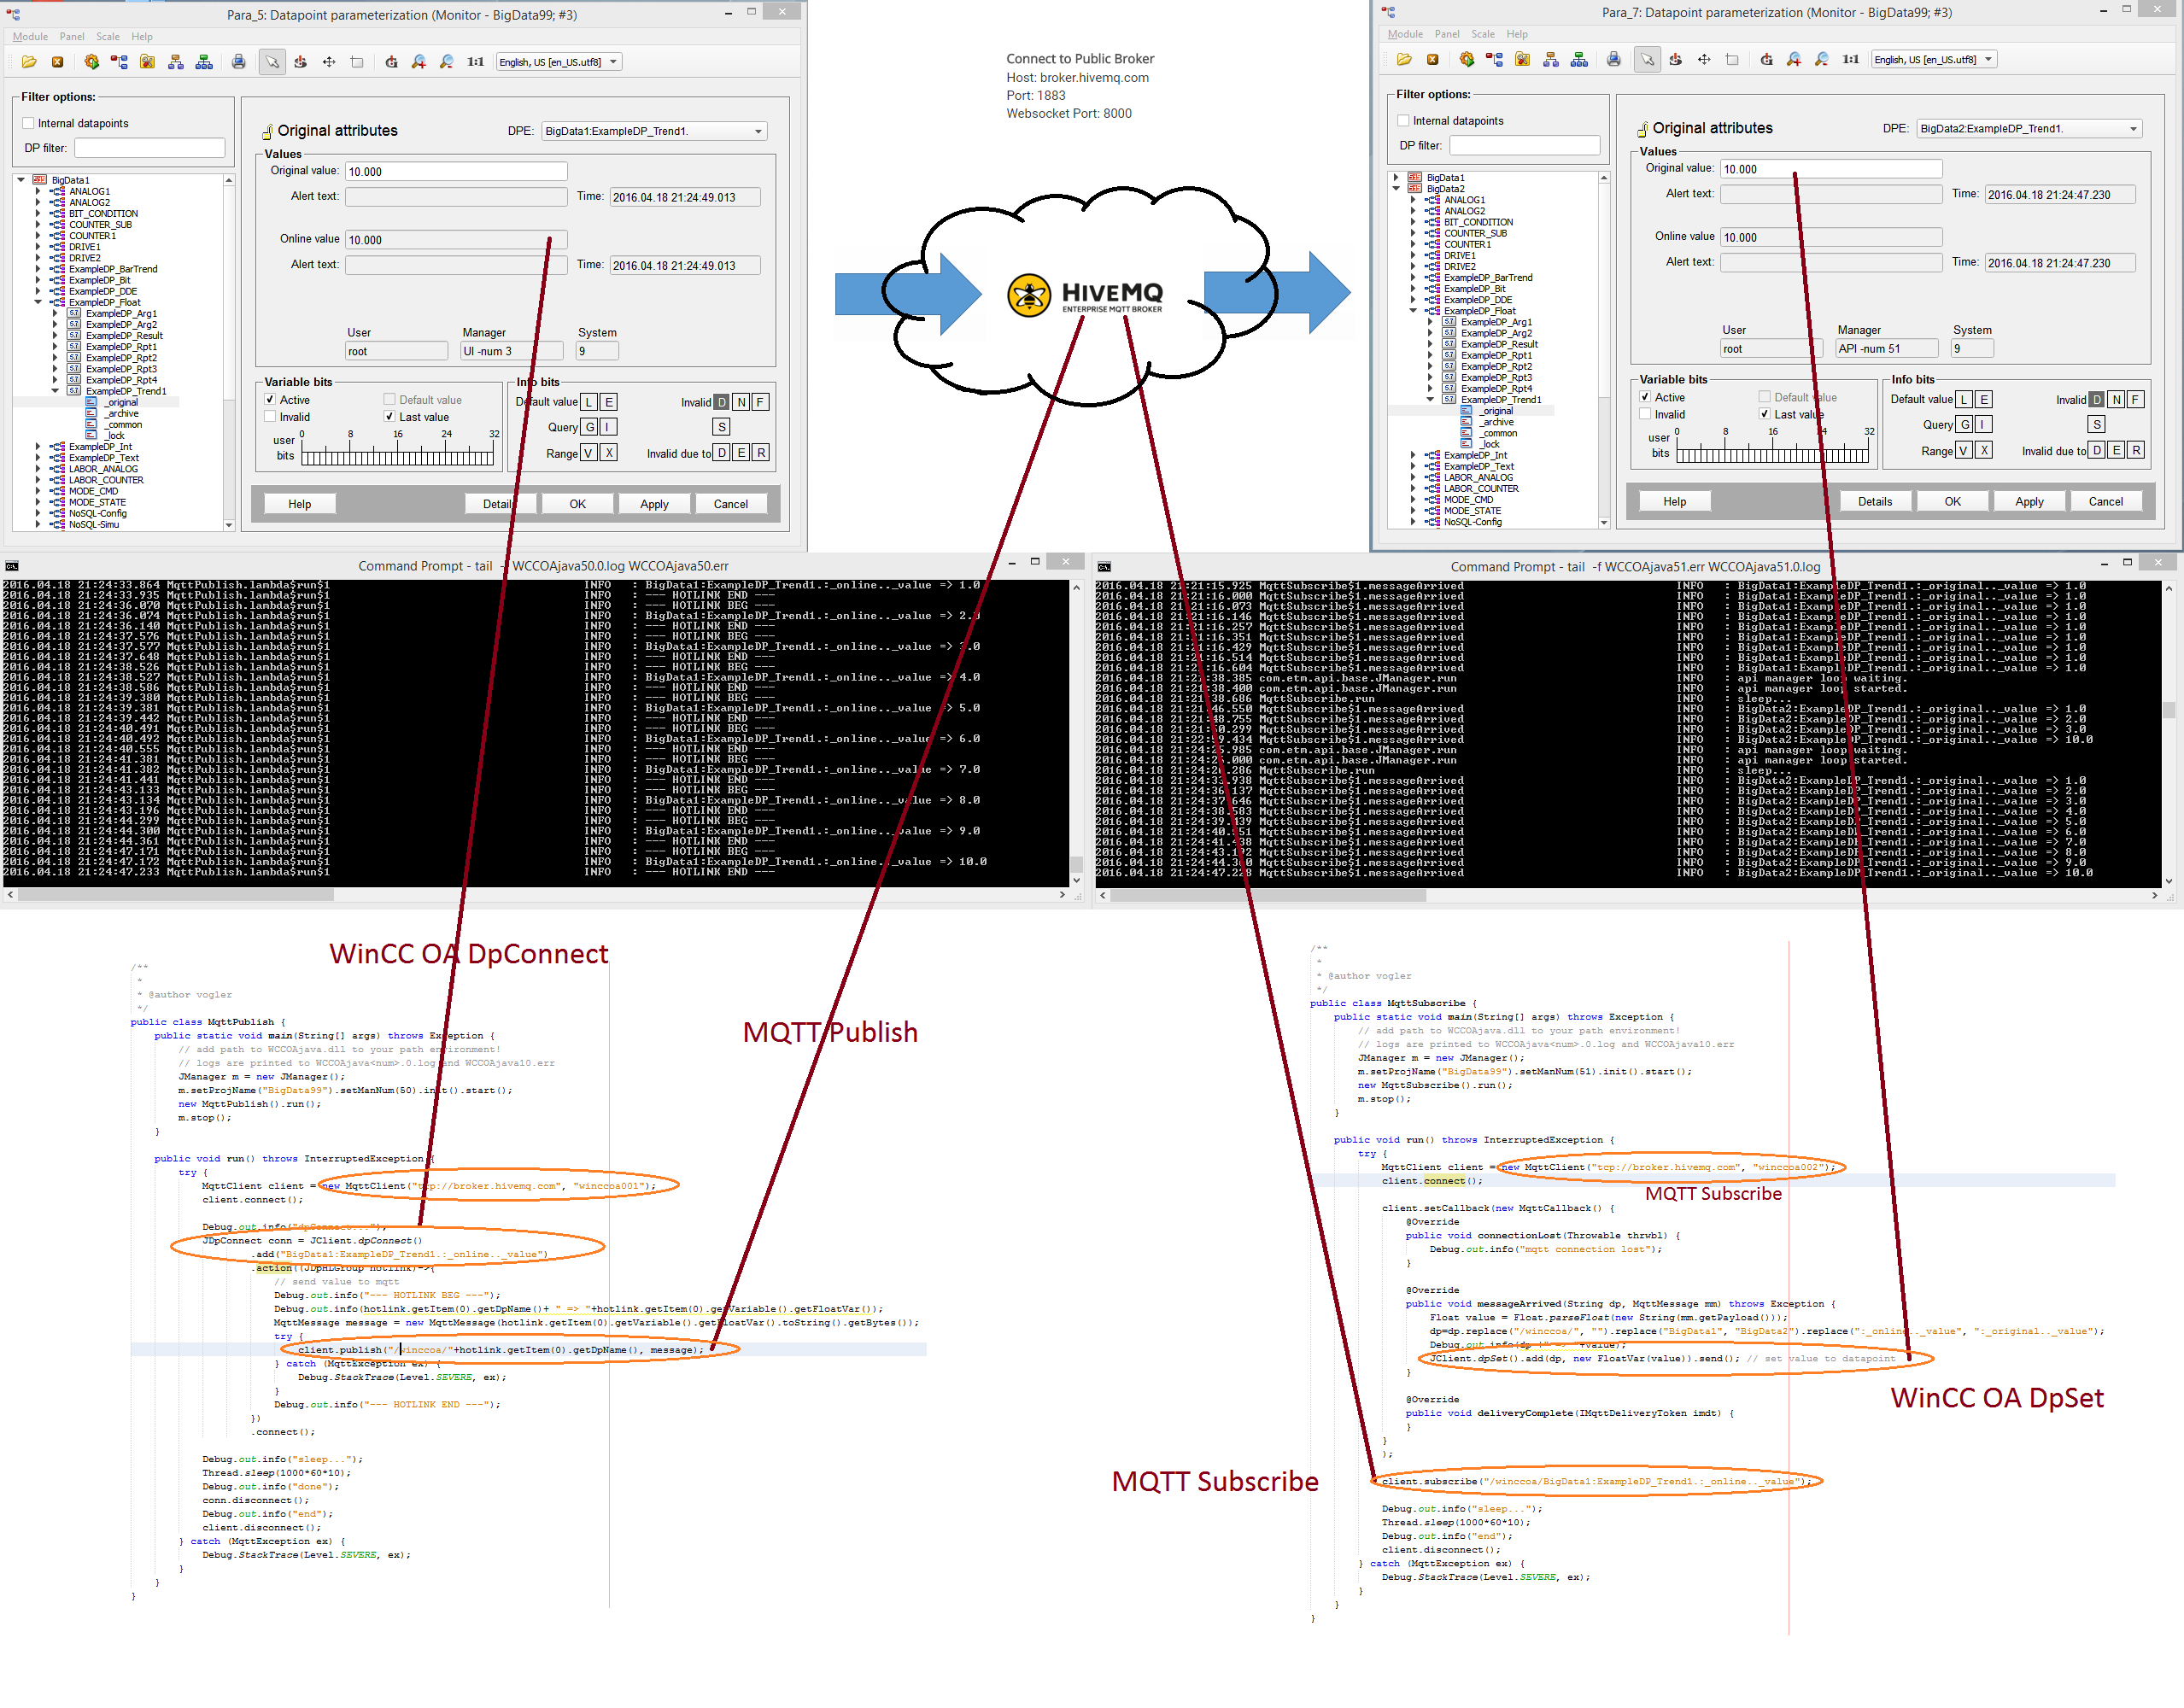
The example is connected to a WinCC OA datapoint in system 1, sends incoming values through MQTT to HiveMQ (http://www.hivemq.com/try-out/, there is a public available MQTT broker for testing available). Another Java API Manager is subscribed to the MQTT broker, receives the values changes by MQTT and sets it to the WinCC OA system 2…

OA-MQTT-OA


ElasticSearch and WinCC OA …

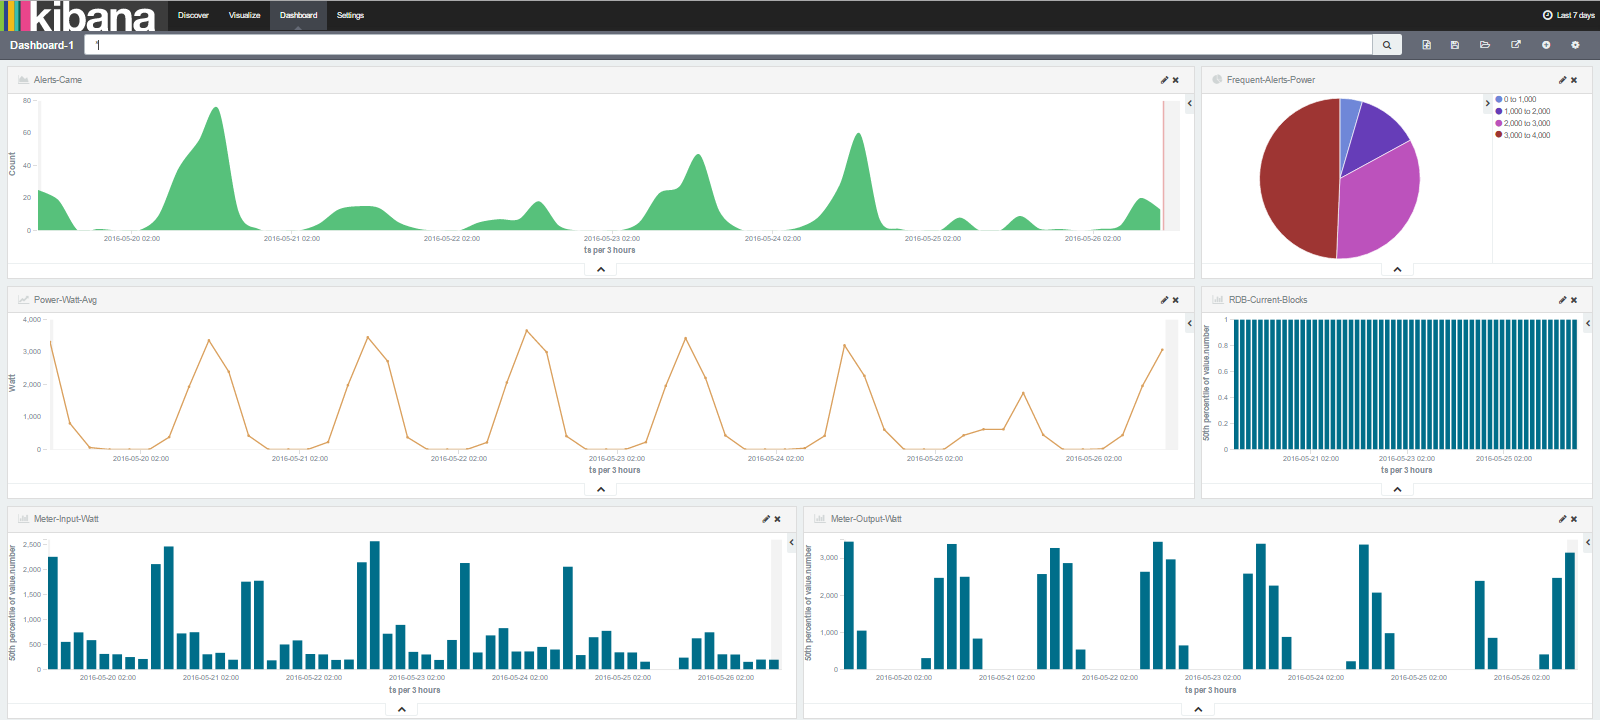
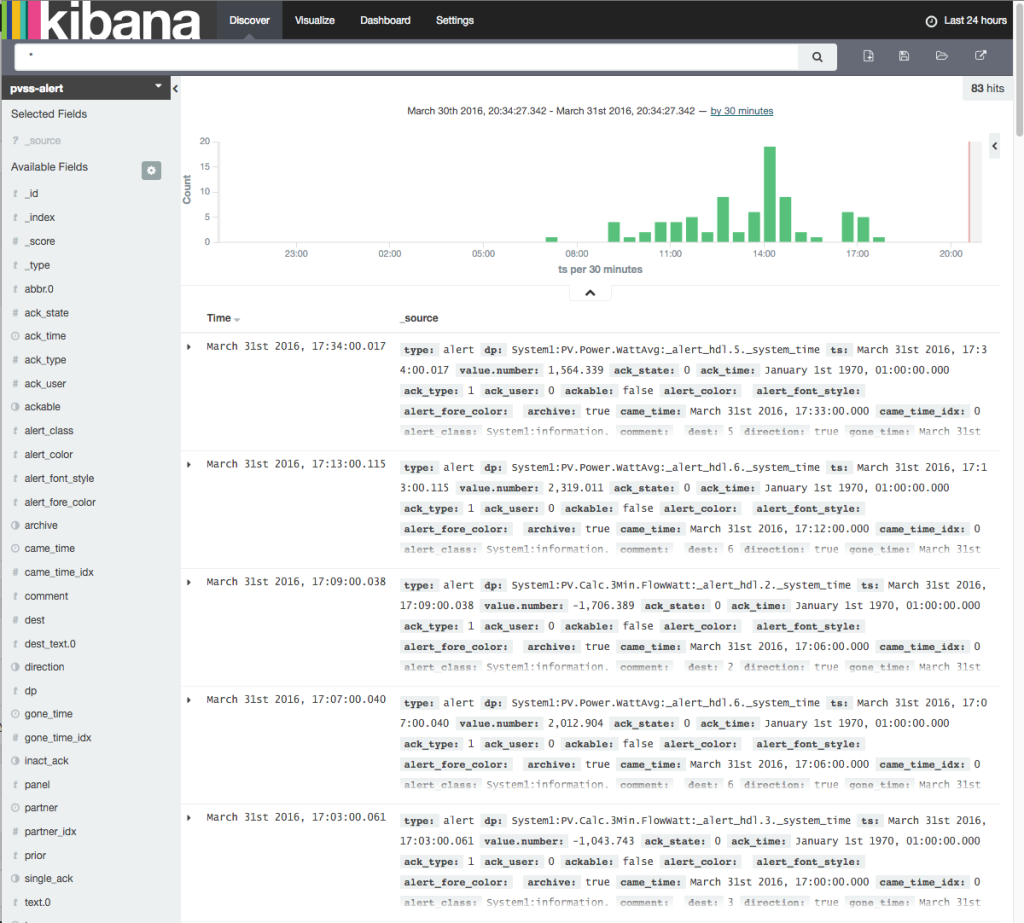
With a Java-Datalogger we can write events and alerts to different data sinks. For example we can use ElasticSearch and Kibana to discover alerts collected by WinCC OA. Elasticsearch provides full text search, analytics, dashboards. And now it also supports graphs!

“Graph introduces a new way to discover, and explore, the relationships that live in your data. Adding relevance to the process of exploration, a unique combination of graph and search means you can do things like detect fraud, recommend content, and more.”  https://www.elastic.co/de/products/graph

Kibana-Dashboard

Screen Shot 2016-03-31 at 20.48.52Screen Shot 2016-03-31 at 20.34.52

Cassandra for WinCC OA & Performance…

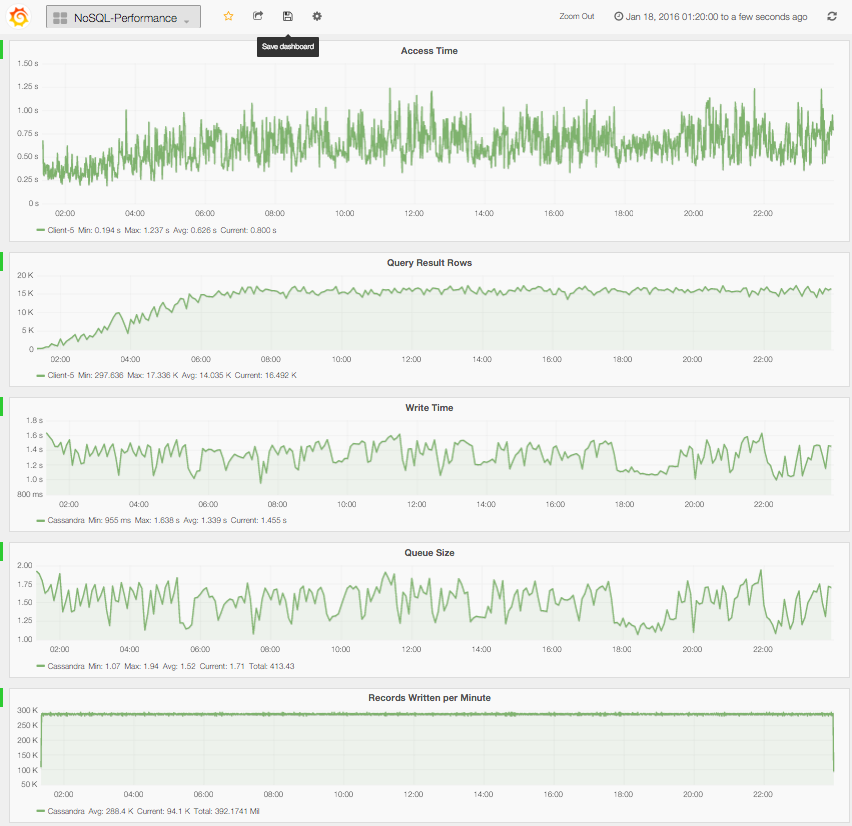
Did a first test with Cassandra as NoSQL database store for WinCC OA event logging.

Cassandra was easy to install, pretty good write performance and very good read performance. Compared to e.g. OpenTSDB the CPU load on client and server are higher.

Test-Setup: 5000 values/second, 24h, 392 Mil.Records, One Hyper-V server on an i7 3.1Ghz with 4 Cassandra nodes, each node with two cores, disks on a shared storage space device with 4 disks and raid 0 (i know that’s not a real life scenario for a NoSQL cluster). WinCC OA and the Java-Historian-DB-Logger running on another Hyper-V server on an old i5 CPU 750 @ 2.67 Ghz.

Cassandra Performance Stats

Cassandra Workload


Databases for WinCC OA Logging….

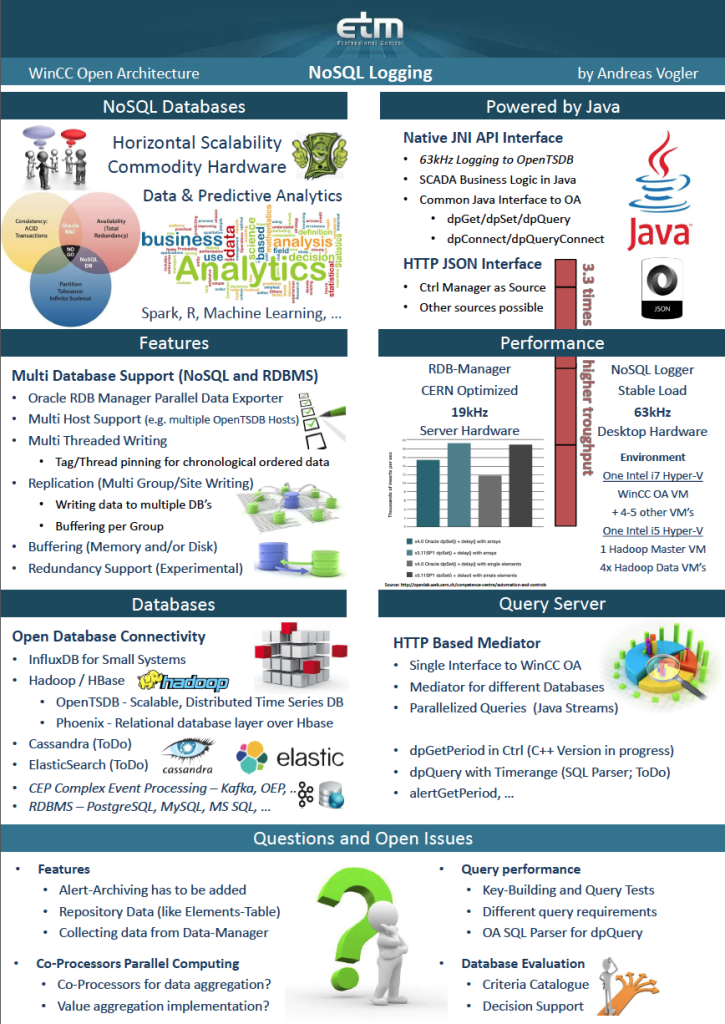
I have implemented a Database Logger for WinCC OA which supports different databases.

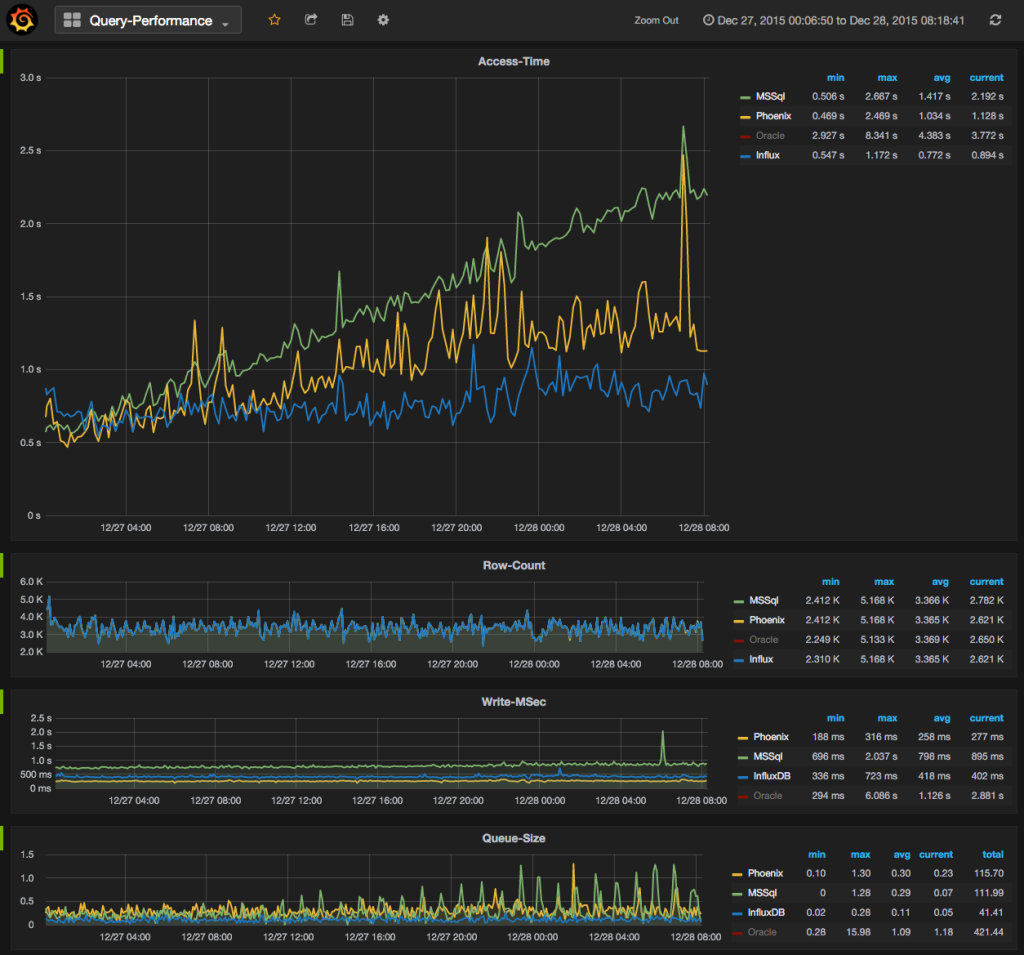
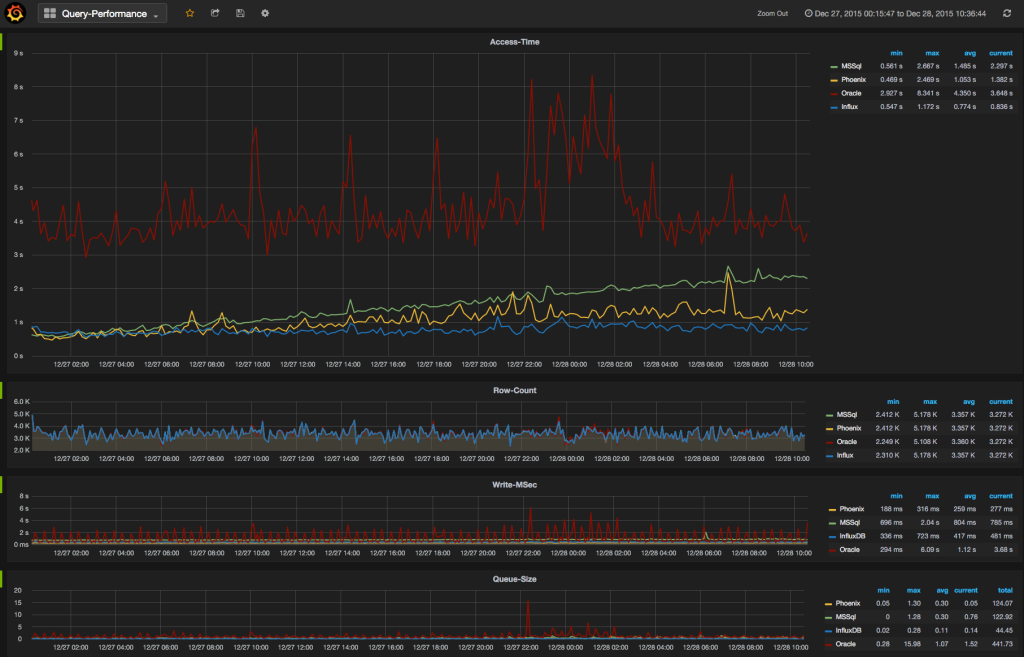
I did now a first test to compare some databases with WinCC OA and time series logging.

The logger is writing 1000 values/second to four databases in parallel: MSSQL Server, InfluxDB, Phoenix (based on Hadoop/HBase) and Oracle.

There are now about 160.000.000 values in each database. About 3.600.000 values are added every hour…

Four Ctrl-Scripts are querying data with dpGetPeriod every 10 seconds, random time frames (between 1 and 2 hours of data).

Screen Shot 2015-12-28 at 09.33.27

Oracle seems to be slower (i think this is related to my test environment), but the access and response times are stable with growing amount of data in the database.

Screen Shot 2015-12-28 at 10.37.13

remark: at 10pm the Oracle DB backup starts.

WinCC OA Docker Image with InfluxDB & Grafana …on a Mac…

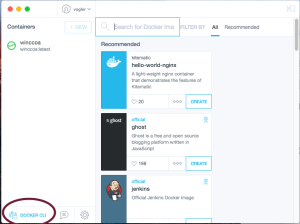
On a Mac install the Docker Toolbox.

https://www.docker.com/docker-toolbox

And click on the “DOCKER CLI”

Screen Shot 2015-12-07 at 11.37.49

The type: docker run -d -p 3000:3000 –name oa1 vogler/winccoa:influxdb startup

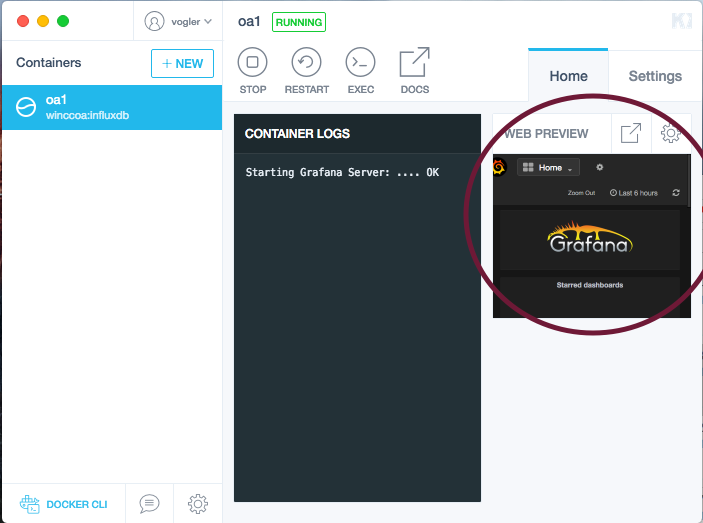
Afterwards you will see your new container and at the preview you can already see the Grafana dashboard, click on it and it will open in your browser.

Screen Shot 2015-12-07 at 11.41.24

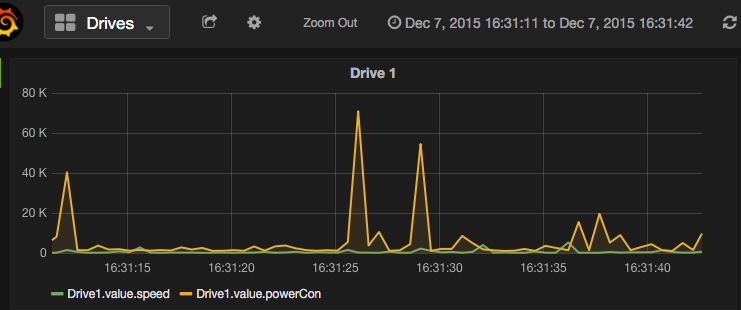
Screen Shot 2015-12-07 at 16.31.58

You have now a running WinCC OA system which is logging some datapoints to the InfluxDB. There is a simple simulation script running which will set random values to Drive1.*

To open the GEDI you have to go to the DOCKER CLI again and type:

bash-3.2$ docker exec -ti oa1 /bin/bash

You now have a bash in the WinCC OA Container. Set the DISPLAY variable to your client (mac). You need a X-Windows-Server on your client (and allow clients to open windows with “xhost +”). At the Mac you may use xquartz: http://www.xquartz.org

dba3d5e6193f:/ # export DISPLAY=macbookpro:0

dba3d5e6193f:/ # gedi &

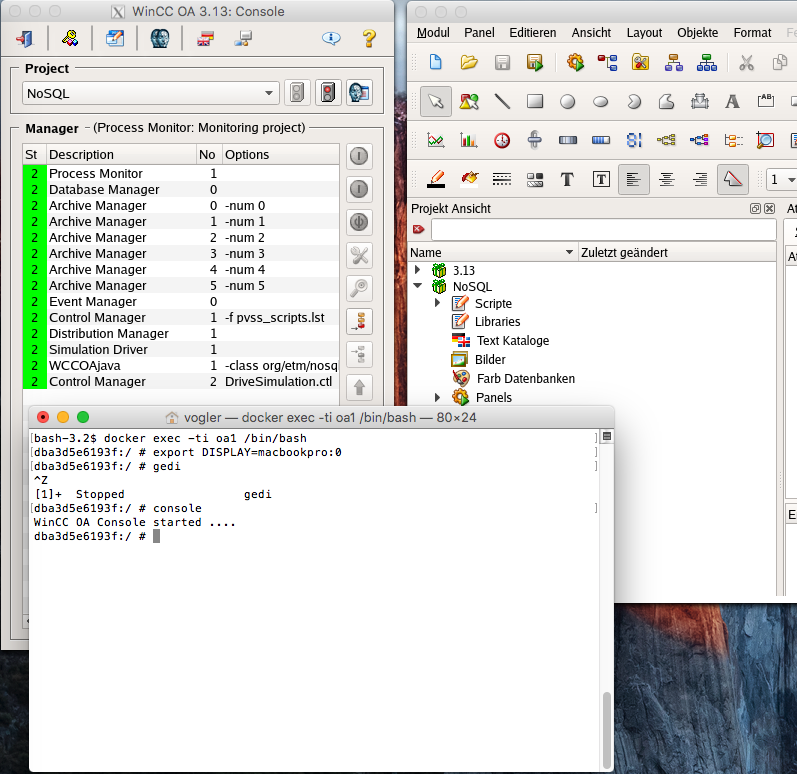
Screen Shot 2015-12-07 at 11.48.47or type “console”, it will open the WinCC OA Console.

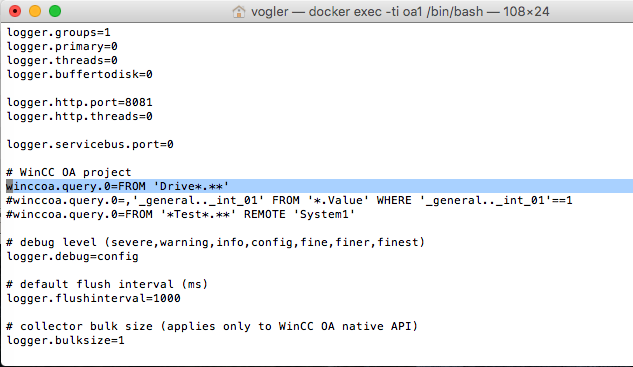
The NoSQL Logger’s configuration file is: /proj/NoSQL/config/config.logger

There you can set the query part of what you wanna log into the InfluxDB. You can specify the FROM clause of a WinCC OA query, also remote queries are possible (if you connect another OA system to this system (distributed system)).

Then you have to restart the NoSQL Database Logger – it is the WCCOAjava program you see in the console. Right, it is implemented in Java with a native API to WinCC OA.

Screen Shot 2015-12-07 at 11.51.44

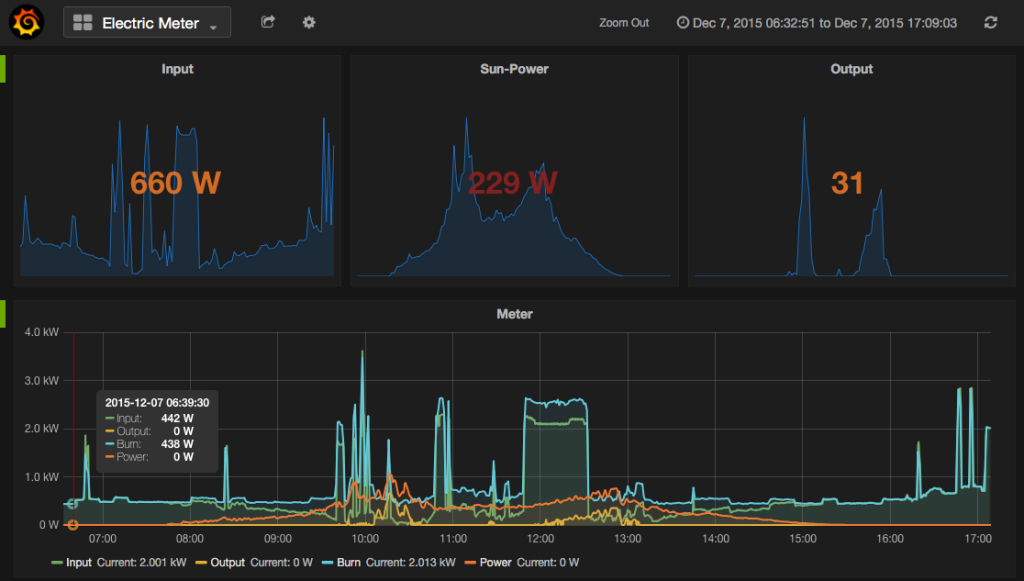
Grafana can be used to create dashboards in a fast and easy way…

Screen Shot 2015-12-07 at 17.09.13

Hadoop OpenTSDB timeseries database and Grafana with WinCC OA…

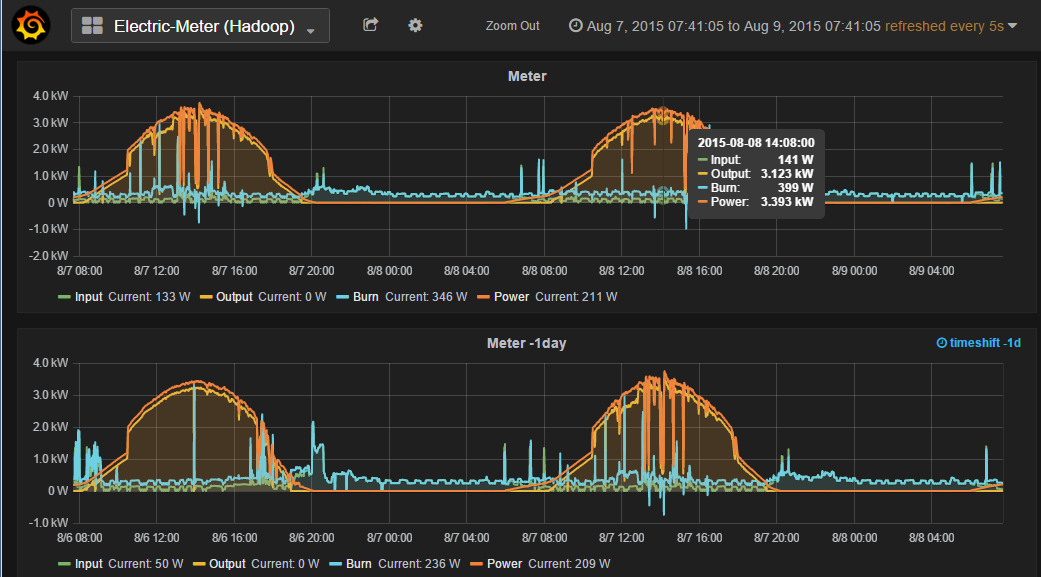
Forwarding events from WinCC OA to OpenTSDB, which is based on HBase. Based on OpenTSDB Grafan can be used to build cool dashboards in a very fast way.

Live Example (my photovoltaic data) : http://82.149.127.81/grafana

On my test environment (i7 with 32gb RAM and 8 threads) i was able to push about 20000(!) values per second from my WinCC OA system to my Hadoop/HBase cluster. WinCC OA and the Hadoop Cluster are running on Hyper-V.

Grafana