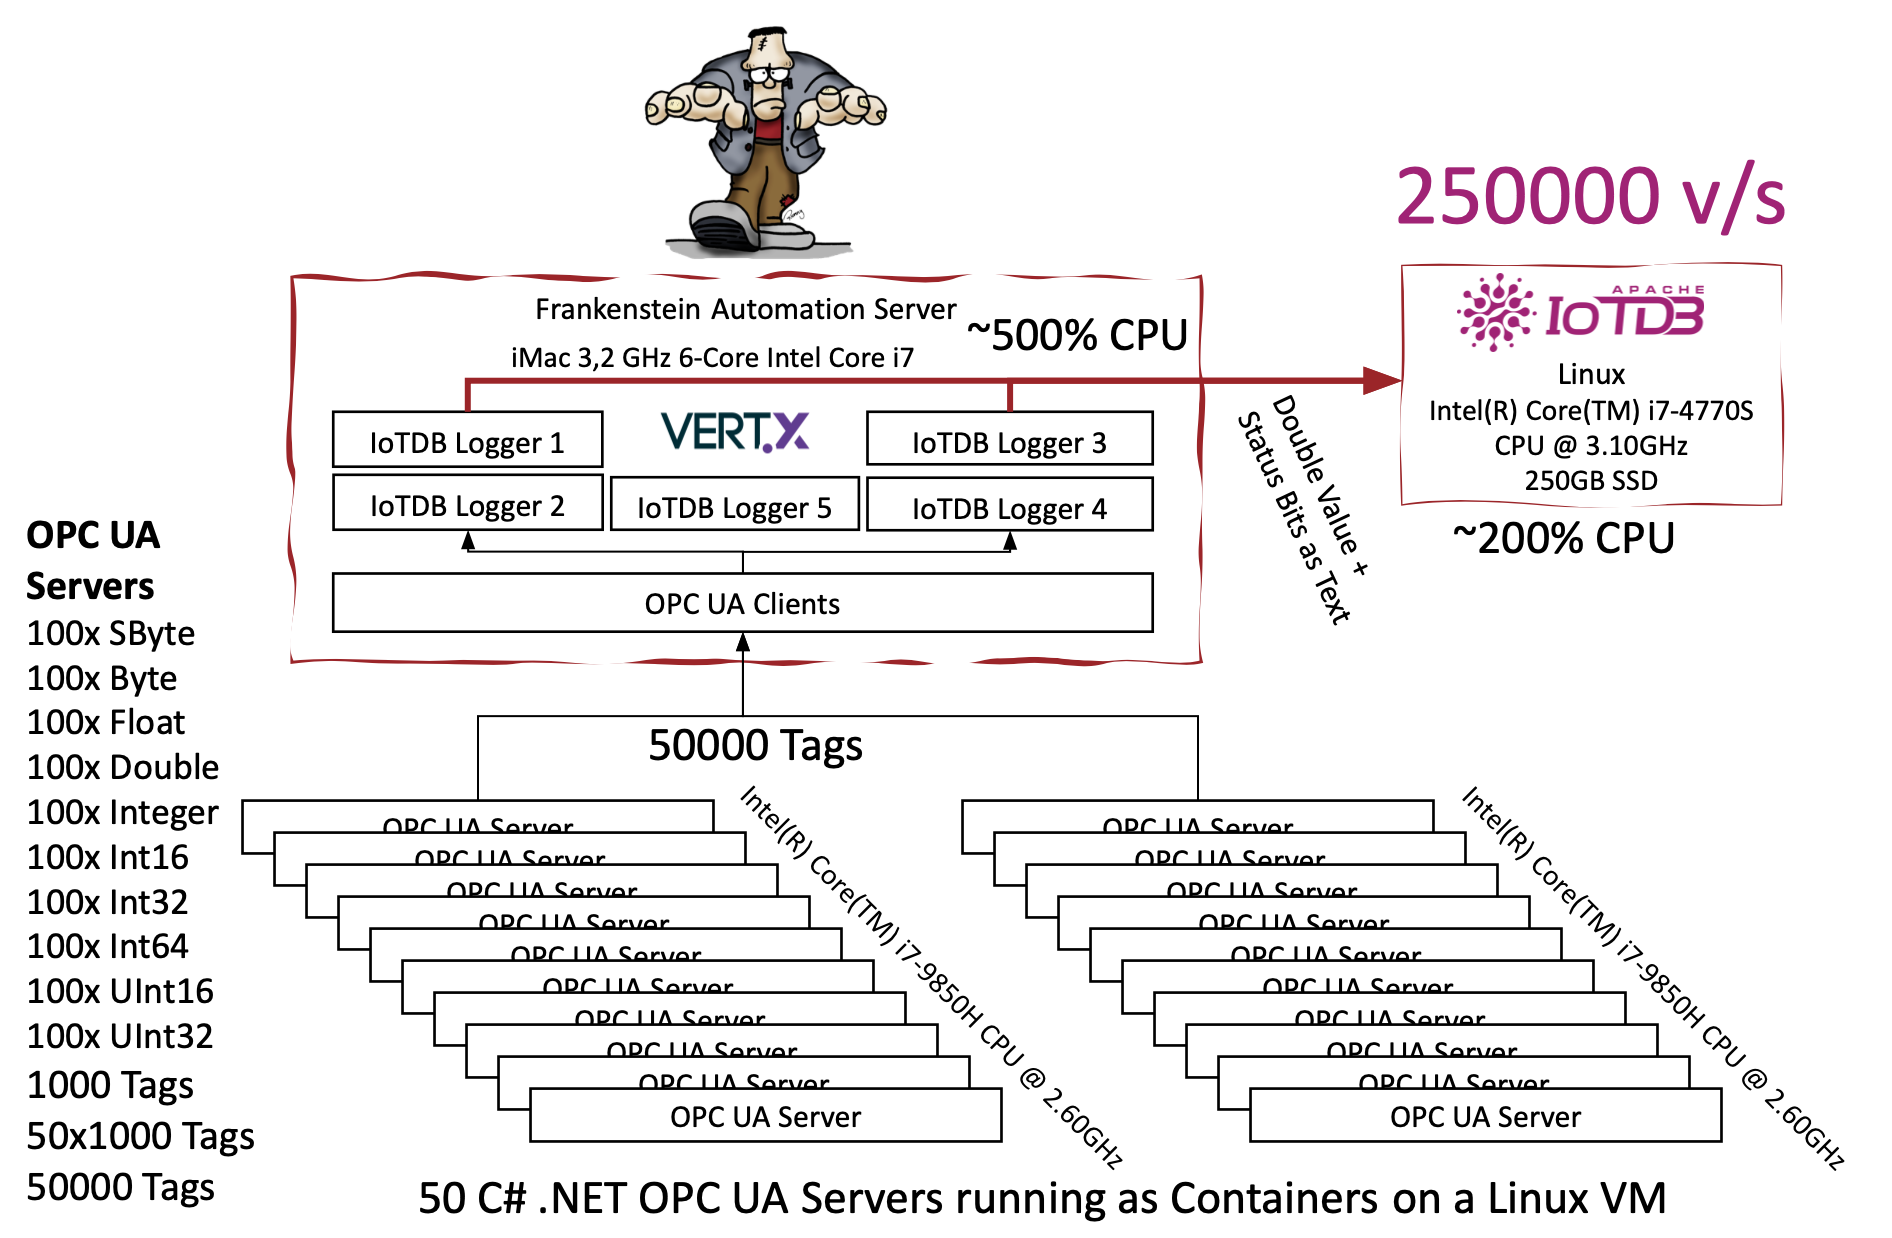
Linux: /etc/exports add a line /home/vogler *(rw,no_subtree_check,insecure) exports -a In this example we do it very insecure...
Windows: mount -o anon <hostname>:/home/vogler z:
Linux: /etc/exports add a line /home/vogler *(rw,no_subtree_check,insecure) exports -a In this example we do it very insecure...
Windows: mount -o anon <hostname>:/home/vogler z:
A GraphQL server can also be queried with a simple GET request:
wget -O - "https://server.rocworks.at/graphql?query=query { getTag(name: \"Input\") { tag { current { value time } } } }"
Lot of times my ssh session get broken because I didn’t do anything for a while. Sometimes I have started “top” just that the connection does not get broken because of inactivity. But this is not really what I wanna do everytime. Luckily the SSH client can be configured to send alive telegrams for every session so that you do not need to pass arguments every time you open a SSH conneciton.
Following settings will make the SSH client to send alive telegrams to the other side every 60 seconds, and give up if it doesn’t receive any response after 2 tries.
~/.ssh/config Host * ServerAliveInterval 60 ServerAliveCountMax 2
Initially you have to init the certbot and get the certificate manually.
# Directories used:
/var/www
/var/www/certbot # handshake sites from certbot
/etc/letsencrypt # certificates are stored here
# Initialize Certbot:
docker run --rm -ti \
-v /var/www:/var/www \
-v /etc/letsencrypt:/etc/letsencrypt \
certbot/certbot certonly --webroot -w /var/www/certbot -d <yor-domain-name> --email your.email@something.com
The letsencrypt and the www directory must be mounted on both containers. Certbot will check the certificates every 12h and nginx must reload the configuration periodically.
nginx:
image: nginx:1.17.8
ports:
- 80:80
- 443:443
volumes:
- /var/www:/var/www
- /etc/nginx.conf:/etc/nginx/nginx.conf
- /etc/letsencrypt:/etc/letsencrypt
command: "/bin/sh -c 'while :; do sleep 6h & wait $${!}; nginx -s reload; done & nginx -g \"daemon off;\"'"
certbot:
image: certbot/certbot
restart: unless-stopped
volumes:
- /var/www:/var/www
- /etc/letsencrypt:/etc/letsencrypt
entrypoint: "/bin/sh -c 'trap exit TERM; while :; do certbot renew --webroot -w /var/www/certbot; sleep 12h & wait $${1}; done;'"
Nginx must be configured to publish the certbots well-known sites for the handshake and your sites must be configured to use the certificates from letsencrypt.
server {
listen 80;
server_name <your-domain-name>;
server_tokens off;
location /.well-known/acme-challenge/ {
root /var/www/certbot;
}
location / {
return 301 https://$host$request_uri;
}
}
server {
listen 443 ssl;
server_name vcm.winccoa.at;
ssl_certificate /etc/letsencrypt/live/<your-domain-name>/fullchain.pem;
ssl_certificate_key /etc/letsencrypt/live/<your-domain-name>/privkey.pem;
root /var/www;
index index.html;
location / {
try_files $uri $uri/ =404;
}
This repository on Github contains Dockerfiles and samples to build Docker images for WinCC OA products.
Download and unzip the CentOS WinCC OA rpm’s to the centos/software directory.
Only put those WinCC OA rpm’s into the directory which you want to have installed in your image. For a minimum image you only need the base packag of WinCC OA.
WinCC_OA_3.16-base-rhel-0-17.x86_64.rpm
Build your WinCC OA Docker image with:
docker build -t winccoa:3.16 .
The project should be mounted on /proj/start as a volume to your docker container.
And you may also mount a shield file to your docker container.
Example how to startup a WinCC OA project in a container:
docker run -d
--name winccoa
--hostname winccoa-server
-v ~/shield.txt:/opt/WinCC_OA/3.16/shield.txt
-v /proj/DemoApplication_3.16:/proj/start
-p 5678:5678
winccoa:3.16
To start a WinCC OA client application like a Gedi or a User-Interface you have to adapt your config file so that the proxy settings point to the WinCC OA server container. You can just create a copy of your config file (e.g. config.ui) and adapt the settings.
[general]
data = "winccoa-server"
event = "winccoa-server"
mxProxy = "winccoa-server <your-docker-host-name>:5678 cert"
Then you can startup a Gedi/Ui with:
docker run --rm
-e DISPLAY=$DISPLAY
-v /tmp/.X11-unix:/tmp/.X11-unix
-v /proj/DemoApplication_3.16:/proj/default
-v /proj/DemoApplication_3.16/config/config.ui:/proj/default/config/config
winccoa:3.16
WCCOAui -autoreg -m gedi -proj default
Sure you can also use a copy of your project directory (or a git checkout if you use git) and adapt the config file.
With the Project Administration you can create a new project in the /proj directory.
docker run -ti --rm
-e DISPLAY=$DISPLAY
-v /tmp/.X11-unix:/tmp/.X11-unix
-v /proj:/proj
winccoa:3.16
WCCOAui -projAdmin
For sure what we have done with the Gedi can also be done with Control-Managers and Drivers. And in theory that can also be done with Kubernetes and so you can run your SCADA project in a Kubernetes Cluster.
The subdomain server.rocworks.at is redirected by my provider to my IP at home where Nginx (with Letsencrypt Certificate) is running and it forwards /grafana to my Grafana Docker Instance. Access to Grafana is possible via https://server.rocworks.at/grafana.
Nginx Configuration (sites-enabled/default)
server {
listen 80 default_server;
listen [::]:80 default_server;
root /var/www/html;
index index.html index.htm index.nginx-debian.html;
server_name server.rocworks.at;
location / {
try_files $uri $uri/ =404;
}
location /grafana/ {
proxy_pass http://docker1:3000/;
}
}
Grafana Configuration (/etc/grafana/grafana.ini)
[server]
# Protocol (http or https)
protocol = http
# The http port to use
http_port = 3000
# The public facing domain name used to access grafana from a browser
domain = server.rocworks.at
# Root Url (NOTE: there is not Port in the URL)
root_url = %(protocol)s://%(domain)s/grafana
enforce_domain = false
[root@avcentos ~]# cat pgbackup.sh
cn=postgres # set container name
db=${1:-mydb}
docker exec -t $cn pg_dump -c -U postgres $db > dump_`date +%d-%m-%Y"-"%H%M`.sql
[root@avcentos ~]# cat pgrestore.sh
if [ ! -f "$1" ]
then
echo File does not exist.
else
cn=postgres # set container name
db=${2:-mydb}
echo Restore to $db...
cat $1 | docker exec -i $cn psql -U postgres -d $db
fi
# First kill connected sessions
SELECT pg_terminate_backend(pg_stat_activity.pid)
FROM pg_stat_activity
WHERE pg_stat_activity.datname = 'mydb';
# Drop your database
DROP DATABASE mydb;
If you have multiple services running on Docker with different ports, you have to open ports in your firewall and you have to access the services via different ports in the browser. To have one access port (port 80 or 443) you can use a reverse proxy.
In our case we used NGINX to redirect the access to Kibana (Elasticsearch Dashboard Tool) and PgAdmin4 (PostgreSQL Admin Tool) so that we can access both services on the same port (80) in the browser with different base paths: http://localhost/kibana and http://localhost/pgadmin.
version: '3.0'
services:
elasticsearch:
hostname: elasticsearch
image: elasticsearch:7.5.0
ports:
- 9200:9200
- 9300:9300
volumes:
- esdata:/usr/share/elasticsearch/data
environment:
- discovery.type=single-node
- "ES_JAVA_OPTS=-Xms512m -Xmx512m"
kibana:
hostname: kibana
image: kibana:7.5.0
depends_on:
- elasticsearch
environment:
- XPACK_MONITORING_ENABLED=false
- LOGGING_QUIET=true
- SERVER_BASEPATH=/kibana
- SERVER_REWRITEBASEPATH=true
postgres:
hostname: postgres
image: postgres:12.1
ports:
- 5432:5432
volumes:
- postgresdb:/var/lib/postgresql/data
environment:
- POSTGRES_PASSWORD=manager
pgadmin:
hostname: pgadmin
image: dpage/pgadmin4
volumes:
- pgadmin:/var/lib/pgadmin
environment:
- PGADMIN_DEFAULT_EMAIL=postgres
- PGADMIN_DEFAULT_PASSWORD=manager
- GUNICORN_ACCESS_LOGFILE=/dev/null
proxy:
hostname: proxy
image: nginx:1.17.8
ports:
- 80:80
volumes:
- ./nginx.conf:/etc/nginx/nginx.conf
depends_on:
- kibana
- pgadmin
volumes:
esdata:
postgresdb:
pgadmin:
user nginx;
worker_processes auto;
error_log /var/log/nginx/error.log warn;
pid /var/run/nginx.pid;
events {
worker_connections 1024;
}
http {
include /etc/nginx/mime.types;
default_type application/octet-stream;
log_format main '$remote_addr - $remote_user [$time_local] "$request" '
'$status $body_bytes_sent "$http_referer" '
'"$http_user_agent" "$http_x_forwarded_for"';
access_log /dev/null;
sendfile on;
#tcp_nopush on;
keepalive_timeout 65;
#gzip on;
server {
listen 80;
root /var/www;
index index.html;
location / {
try_files $uri $uri/ =404;
}
location /pgadmin {
proxy_pass http://pgadmin/;
proxy_http_version 1.1;
proxy_set_header X-Script-Name /pgadmin;
proxy_set_header Upgrade $http_upgrade;
proxy_set_header Connection 'upgrade';
proxy_set_header Host $host;
proxy_cache_bypass $http_upgrade;
}
location /kibana {
proxy_pass http://kibana:5601/kibana;
proxy_http_version 1.1;
proxy_set_header Upgrade $http_upgrade;
proxy_set_header Connection 'upgrade';
proxy_set_header Host $host;
proxy_cache_bypass $http_upgrade;
}
}
}
filebeat.config:
modules:
path: ${path.config}/modules.d/*.yml
reload.enabled: false
filebeat.autodiscover:
providers:
- type: docker
hints.enabled: true
processors:
- add_cloud_metadata: ~
setup.ilm:
enabled: false
output.elasticsearch:
hosts: '${ELASTICSEARCH_HOSTS:elasticsearch:9200}'
username: '${ELASTICSEARCH_USERNAME:}'
password: '${ELASTICSEARCH_PASSWORD:}'
version: '3.0'
services:
elasticsearch:
hostname: elasticsearch
image: elasticsearch:7.5.0
ports:
- 9200:9200
- 9300:9300
volumes:
- esdata:/usr/share/elasticsearch/data
environment:
- discovery.type=single-node
- "ES_JAVA_OPTS=-Xms512m -Xmx512m"
kibana:
hostname: kibana
image: kibana:7.5.0
ports:
- 5601:5601
depends_on:
- elasticsearch
environment:
- XPACK_MONITORING_ENABLED=false
- LOGGING_QUIET=true
filebeat:
user: root
hostname: filebeat
image: docker.elastic.co/beats/filebeat:7.5.1
command: filebeat -e -strict.perms=false
volumes:
- ./filebeat.yaml:/usr/share/filebeat/filebeat.yml
- /var/lib/docker/containers:/var/lib/docker/containers:ro
- /var/run/docker.sock:/var/run/docker.sock:ro
environment:
- output.elasticsearch.hosts=["elasticsearch:9200"]
depends_on:
- elasticsearch
volumes:
esdata:
docker-compuse up -d
Then you can access the logs via Kibana in the browser: http://localhost:5601/
Visual C++ 2010 Redistributables
F:\Setup\SDKSetup.exe
Start
> Microsoft Windows SDK v7.1
> Windows SDK 7.1 Command Prompt
c:\app\graalvm-ce-19.2.1\bin\native-image -jar Example.jar ^
--no-fallback ^
--report-unsupported-elements-at-runtime ^
--allow-incomplete-classpath ^