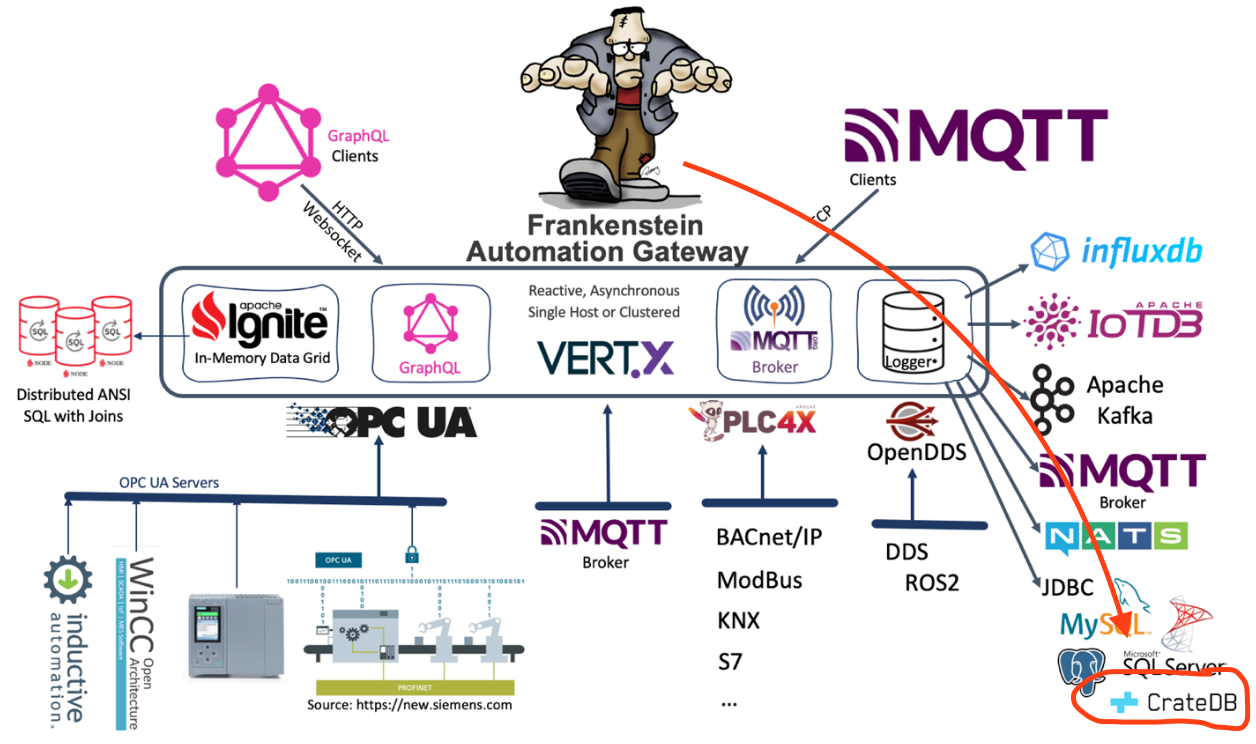
Really like Crate.io … based on Elasticsearch, but with #SQL interface and optimised for time series. Now also added to Frankenstein for #opcua tag logging…
Really like Crate.io … based on Elasticsearch, but with #SQL interface and optimised for time series. Now also added to Frankenstein for #opcua tag logging…
Added #JDBC as logging option to the Open-Source Automation-Gateway Frankenstein. Values from #OPCUA servers can now also be logged to relational databases – #sql is still so great and powerful! Tested with #postgresql #mysql and #mssqlserver … fetching history values via the integrated #graphql server is also included…
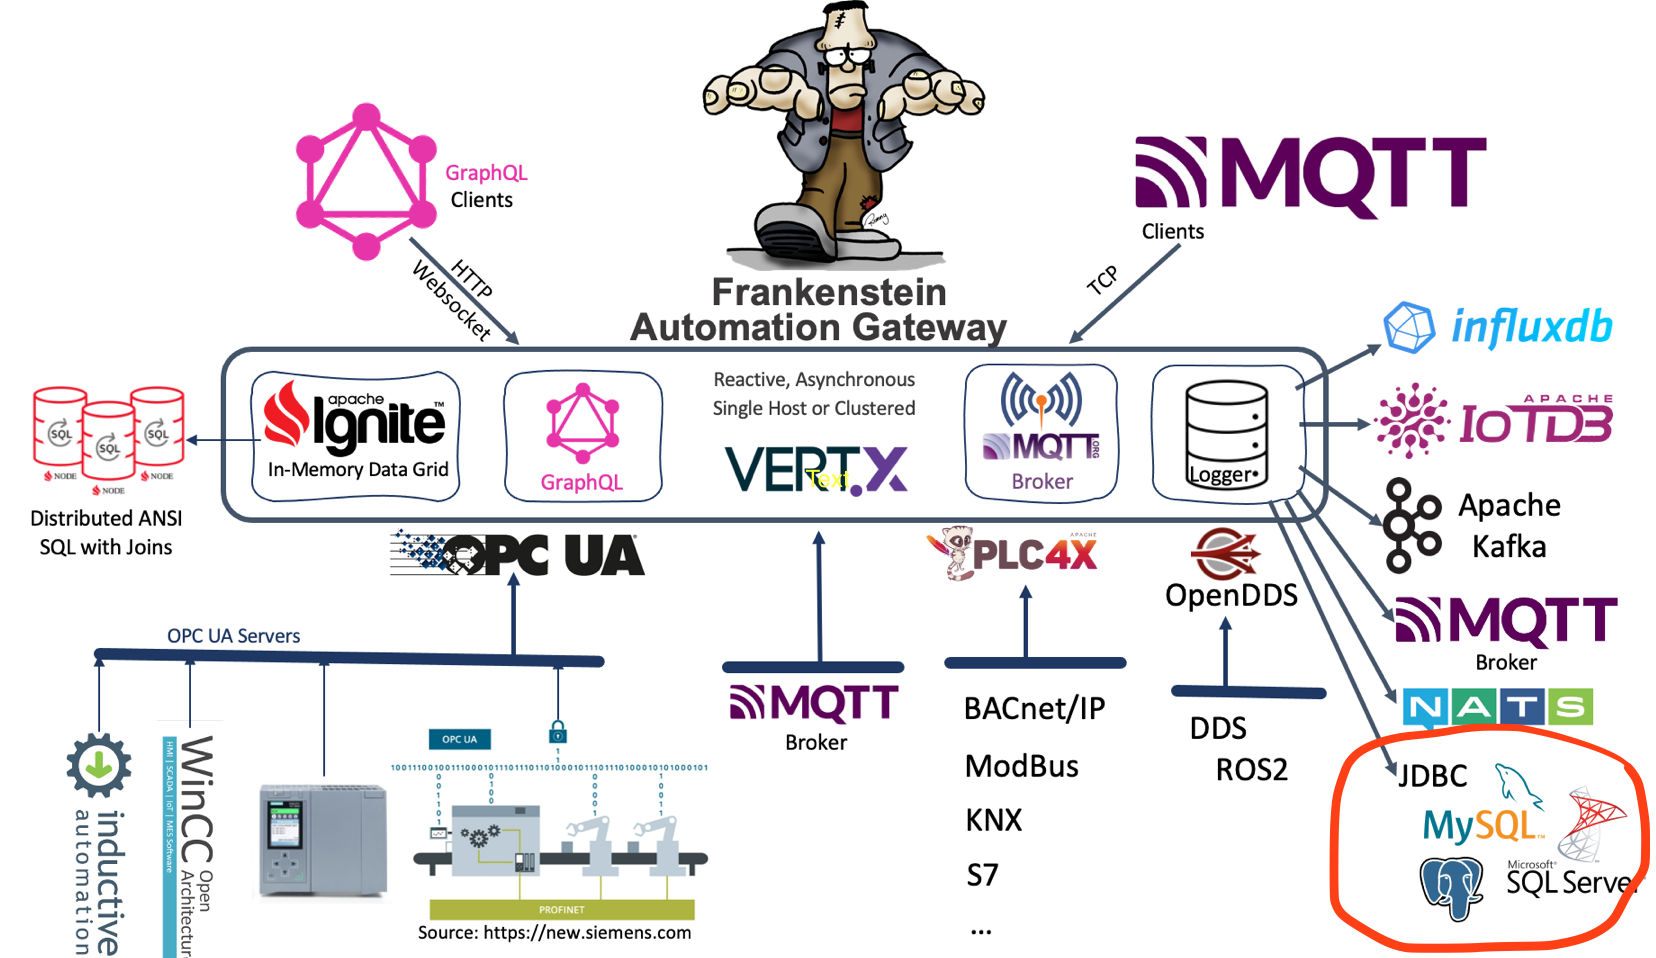
You have to add the JDBC driver to your classpath and set the appropriate JDBC URL path in the Frankenstein configuration file – see an example below. PostgreSQL, MySQL and Microsoft SQL Server JDBC drivers are already included in the build.gradle file (see lib-jdbc/build.gradle) and also appropriate SQL statements are implemented for those relational databases. If you use other JDBC drivers you can add the driver to the lib-jdbc/build.gradle file as runtime only dependency and you may specify SQL statements for insert and select in the configuration file.
You can specify the table name in the config file with the option “SqlTableName”, if you do not specify the table name then “events” will be used as default name.
Create a table with this structure. For PostgreSQL, MySQL and Microsoft SQL Server the table will be created on startup automatically.
CREATE TABLE IF NOT EXISTS public.events
  (
      sys character varying(30) NOT NULL,
      nodeid character varying(30) NOT NULL,
      sourcetime timestamp without time zone NOT NULL,
      servertime timestamp without time zone NOT NULL,
      numericvalue numeric,
      stringvalue text,
      status character varying(30) ,
      CONSTRAINT pk_events PRIMARY KEY (system, nodeid, sourcetime)
  )
  TABLESPACE ts_scada;
Configuration of Frankenstein for JDBC Logging:
Database:
  Logger:
    - Id: postgres
      Type: Jdbc
      Enabled: true
      Url: jdbc:postgresql://nuc1:5432/scada
      Username: system
      Password: manager
      SqlTableName: events
      Logging:
        - Topic: opc/opc1/path/Objects/Demo/SimulationMass/SimulationMass_SByte/+
        - Topic: opc/opc1/path/Objects/Demo/SimulationMass/SimulationMass_Byte/+
Because the SQL dialect can be slightly different with other databases, you can specify the insert and select SQL statement in the config file:
Database:
  Logger:
    - Id: log1
      Type: Jdbc
      Enabled: true
      Url: jdbc:other://nuc1:1111/scada
      Username: system
      Password: manager
      SqlTableName: events
      SqlInsertStatement: >
        INSERT INTO events (sys, nodeid, sourcetime, servertime, numericvalue, stringvalue, status)
         VALUES (?, ?, ?, ?, ?, ?, ?)
         ON CONFLICT ON CONSTRAINT PK_EVENTS DO NOTHING
      SqlQueryStatement: >
        SELECT sourcetime, servertime, numericvalue, stringvalue, status
         FROM events
         WHERE sys = ? AND nodeid = ? AND sourcetime >= ? AND sourcetime <= ?
The history data can also be queried via the GraphQL interface of Frankenstein, see an example query here:
{
  a:NodeValue(System:"opc1", NodeId: "ns=2;s=Scalar_Static_Int64") {
    Value
    mysql:History(Log: "mssql", LastSeconds: 600) {
      Value
      SourceTime
      ServerTime
    }
    pgsql:History(Log: "postgres", LastSeconds: 600) {
      Value
      SourceTime
      ServerTime
    }
  }
  b:NodeValue(System:"opc1", NodeId: "ns=2;s=Scalar_Static_String") {
    Value
    mysql:History(Log: "mysql", LastSeconds: 600) {
      Value
      SourceTime
      ServerTime
    }
    pgsql:History(Log: "postgres", LastSeconds: 600) {
      Value
      SourceTime
      ServerTime
    }
  }
}In this article we use the Frankenstein Automation Gateway to subscribe to one public available OPC UA server (milo.digitalpetri.com) and log tag values to Apache Kafka. Additionally we show how you can create a Stream in Apache Kafka based on the OPC UA values coming from the milo OPC UA server and query those stream with KSQL.
Setup Apache Kafka
We have used the all-in-one Docker compose file from confluent to quickly setup Apache Kafka and KSQL. Be sure that you set your resolvable hostname or IP address of your server in the docker-compose.yml file. Otherwise Kafka clients cannot connect to the broker.
KAFKA_ADVERTISED_LISTENERS: PLAINTEXT://broker:29092,PLAINTEXT_HOST://192.168.1.18:9092
Setup Frankenstein
Install Java 11 (for example Amazon Corretto) and Gradle for Frankenstein. Unzip Gradle to a folder and set your PATH variable to point to the bin directory of Gradle.
Then clone the source of Frankenstein and compile it with Gradle:
git clone https://github.com/vogler75/automation-gateway.git
cd automation-gateway/source/app
gradle build
There is a example config-milo-kafka.yaml file in the automation-gateway/source/app directory which you can use by setting the environment variable GATEWAY_CONFIG.
export GATEWAY_CONFIG=config-milo-kafka.yaml
In this config file we use a public Eclipse Milo OPC UA server. The Id of this connection is “milo“.
OpcUaClient:
  - Id: "milo"
    Enabled: true
    LogLevel: INFO
    EndpointUrl: "opc.tcp://milo.digitalpetri.com:62541/milo"
    UpdateEndpointUrl: false
    SecurityPolicyUri: http://opcfoundation.org/UA/SecurityPolicy#None
    UsernameProvider:
      Username: user1
      Password: password
Here is the configuration of the Kafka Logger where you can configure what OPC UA tags should be published to Kafka. In that case we use a OPC UA Browse Path and a wildcard to use all variables below one node.
Database:
  Logger:
    - Id: kafka1
      Type: Kafka
      Enabled: true
      Servers: server2:9092
      WriteParameters:
        QueueSize: 20000
        BlockSize: 10000
      Logging:
        - Topic: opc/milo/path/Objects/Dynamic/+
Start Frankenstein
export GATEWAY_CONFIG=config-milo-kafka.yaml
gradle run
Create a Stream in KSQL
Start a CLI session to KSQL on the host where the Kafka containers run:
docker exec -ti ksqldb-cli ksql http://ksqldb-server:8088Create a stream for the Kafka “milo” topic
CREATE STREAM milo(
  browsePath VARCHAR KEY,
  sourceTime VARCHAR,
  value DOUBLE,
  statusCode VARCHAR
) WITH (
  KEY_FORMAT='KAFKA',
  KAFKA_TOPIC='milo',
  VALUE_FORMAT='JSON',
  TIMESTAMP='sourceTime',TIMESTAMP_FORMAT='yyyy-MM-dd''T''HH:mm:ss.nX'
);
Then you can execute a KSQL query to get the stream of values from the OPC UA server:
ksql> select browsepath, sourcetime, value from milo emit changes;
+---------------------------------------+---------------------------------------+---------------------------------------+
|BROWSEPATH                             |SOURCETIME                             |VALUE                                  |
+---------------------------------------+---------------------------------------+---------------------------------------+
|Objects/Dynamic/RandomInt32            |2021-05-02T11:29:04.405465Z            |1489592303                             |
|Objects/Dynamic/RandomInt64            |2021-05-02T11:29:04.405322Z            |-6.3980451035323023E+18                |
|Objects/Dynamic/RandomFloat            |2021-05-02T11:29:04.405350Z            |0.7255345                              |
|Objects/Dynamic/RandomDouble           |2021-05-02T11:29:04.405315Z            |0.23769088795602633                    |
The Frankenstein Automation Gateway can now write OPC UA tag values to the Apache IoTDB. Did some rough performance tests with 50 OPC UA servers and one IoTDB… the IoTDB is pretty impressive fast. Also the data model and terminology is interesting and it seems to fit good to a hirarchical structure in OPC UA.
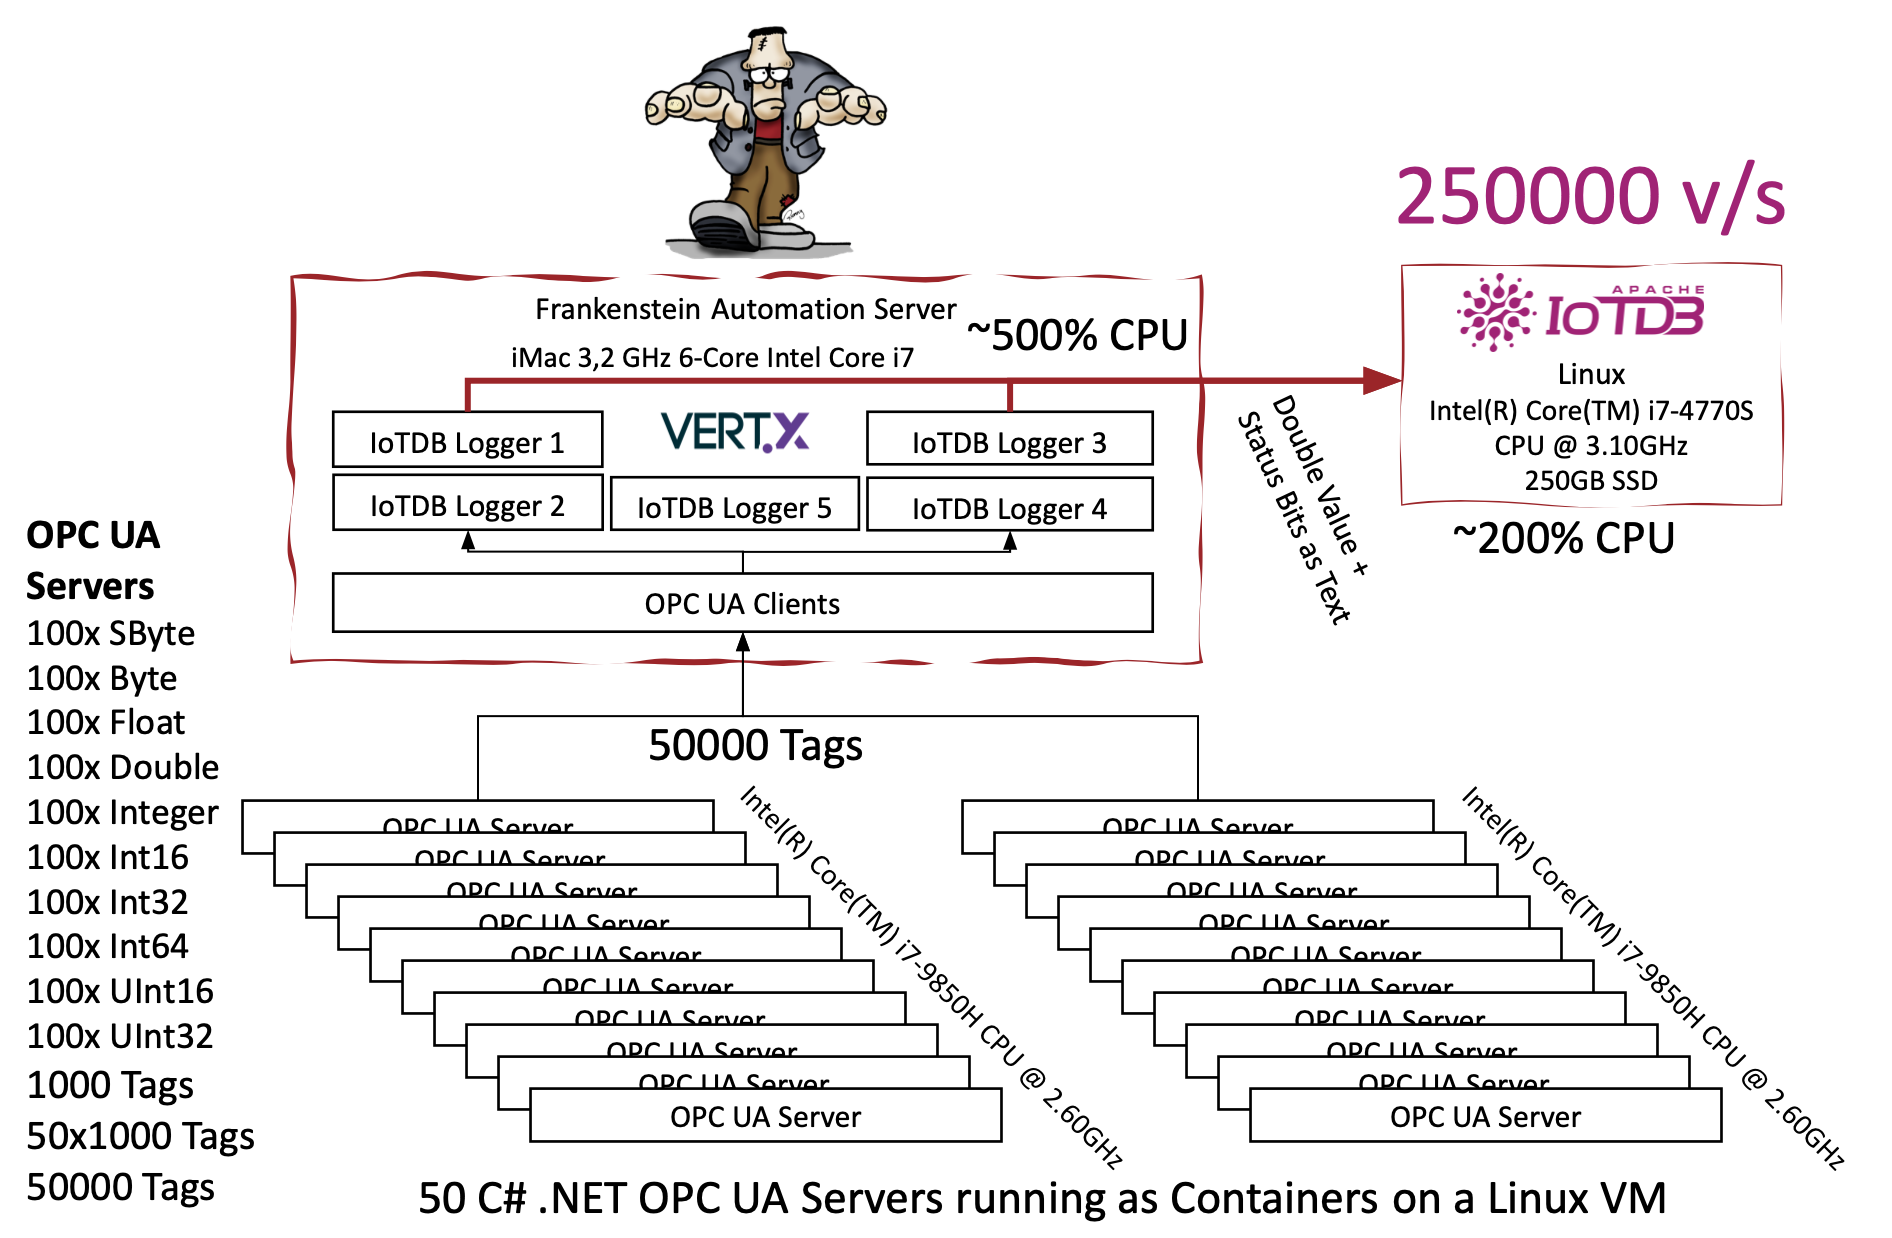
In this lab I have connected 50 OPC UA servers (based on a .NET OPC UA server example) to Frankenstein. Each OPC UA server publishes 1000 tags of different type, so in summary we have 50000 tags connected to Frankenstein. The publish rate can be adjusted by setting an OPC UA tag. Sure, we do that via GraphQL over Frankenstein. On my commodity hardware I ended with writing about 250Khz to the IoTDB with an CPU load of ~200%. So, I assume the IoTDB is able to handle much more value changes per second.
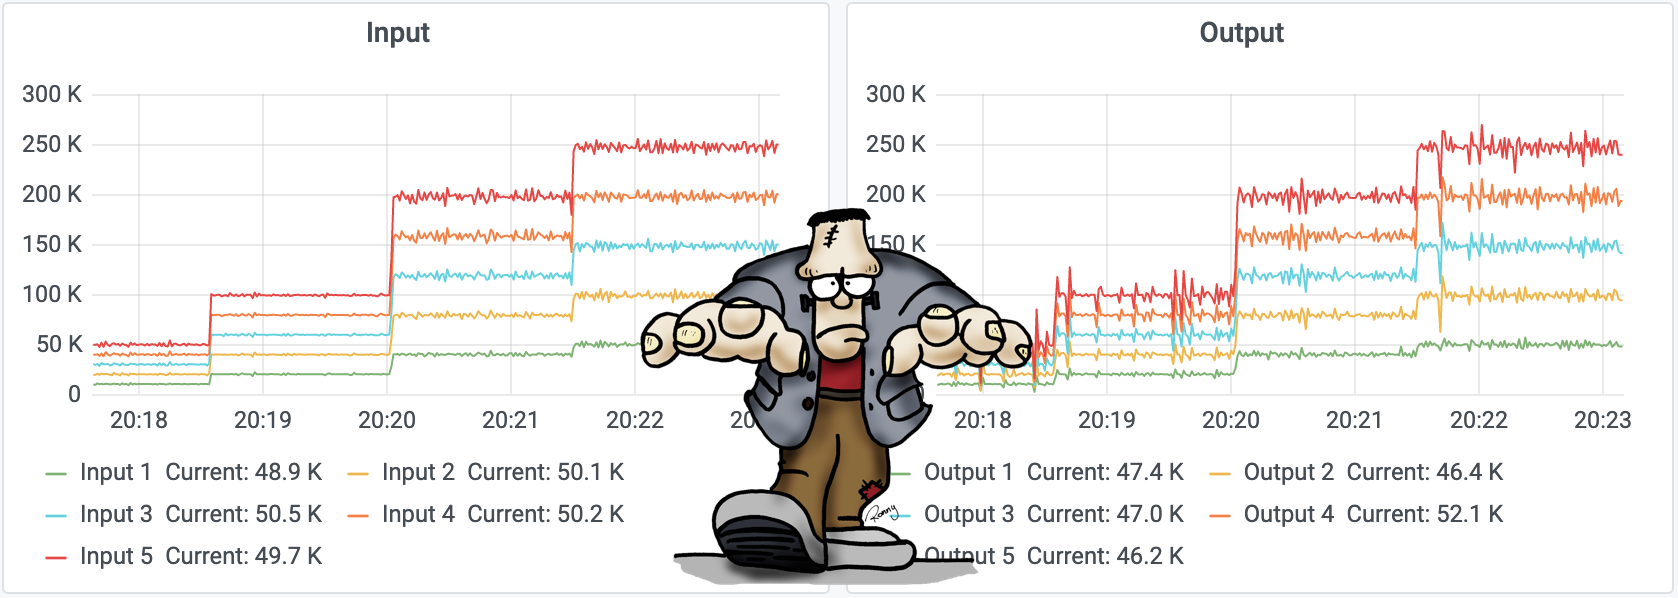
Figured out that one DB Logger inside of Frankenstein roughly is able to handle 100000 events per second. We can spawn multiple DB Logger for scalabilty. Vert.X can then use multiple cores (Vert.X calls this pattern the Multi-Reactor Pattern to distinguish it from the single threaded reactor pattern).
Just to note: there is only a memory buffer implemented, so if the DB is down, then the values will be lost if the buffer runs out of space. But I think to handle such situations it would make sense to put Apache Kafka between the Gateway and the Database.
GraphQL Query to set the simulation interval:
query ($v: String) {
  Systems {
    opc1 { Demo { SimulationInterval { SetValue(Value: $v) } } }
    opc2 { Demo { SimulationInterval { SetValue(Value: $v) } } }
    opc3 { Demo { SimulationInterval { SetValue(Value: $v) } } }
    opc4 { Demo { SimulationInterval { SetValue(Value: $v) } } }
    opc5 { Demo { SimulationInterval { SetValue(Value: $v) } } }
    opc6 { Demo { SimulationInterval { SetValue(Value: $v) } } }
    opc7 { Demo { SimulationInterval { SetValue(Value: $v) } } }
    opc8 { Demo { SimulationInterval { SetValue(Value: $v) } } }
    opc9 { Demo { SimulationInterval { SetValue(Value: $v) } } }
    ...
  }
}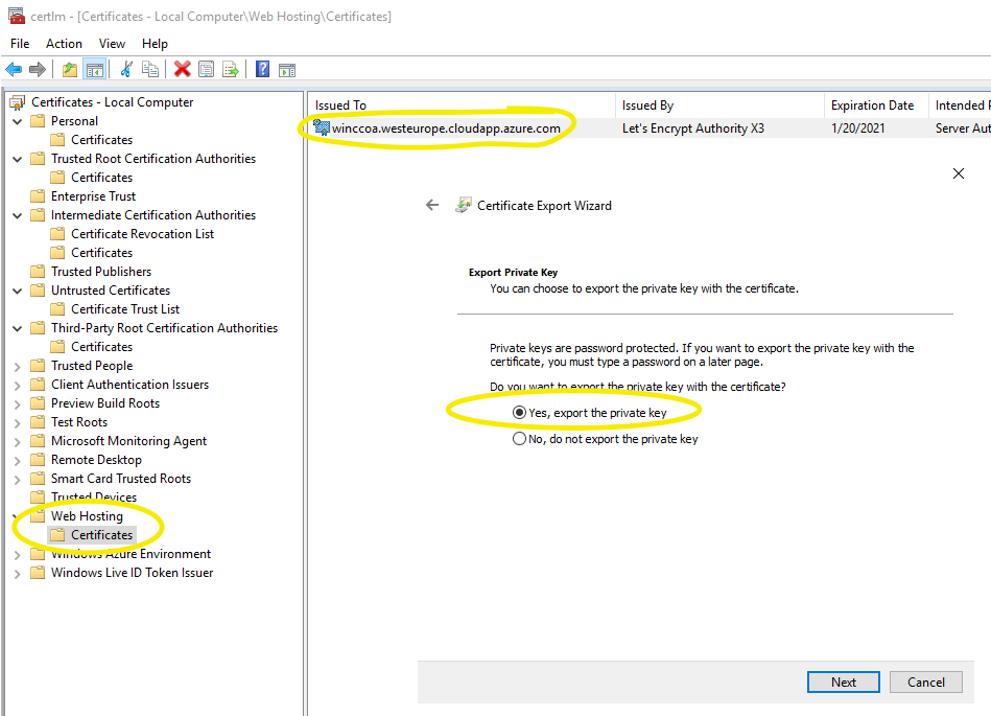
Query Variables: {"v": "250"}This is a manual way to get and use Certificates from Letsencrypt with the Webserver (ULC UX) in WinCC Open Architecture. You have to update the certificate manually before it expires.
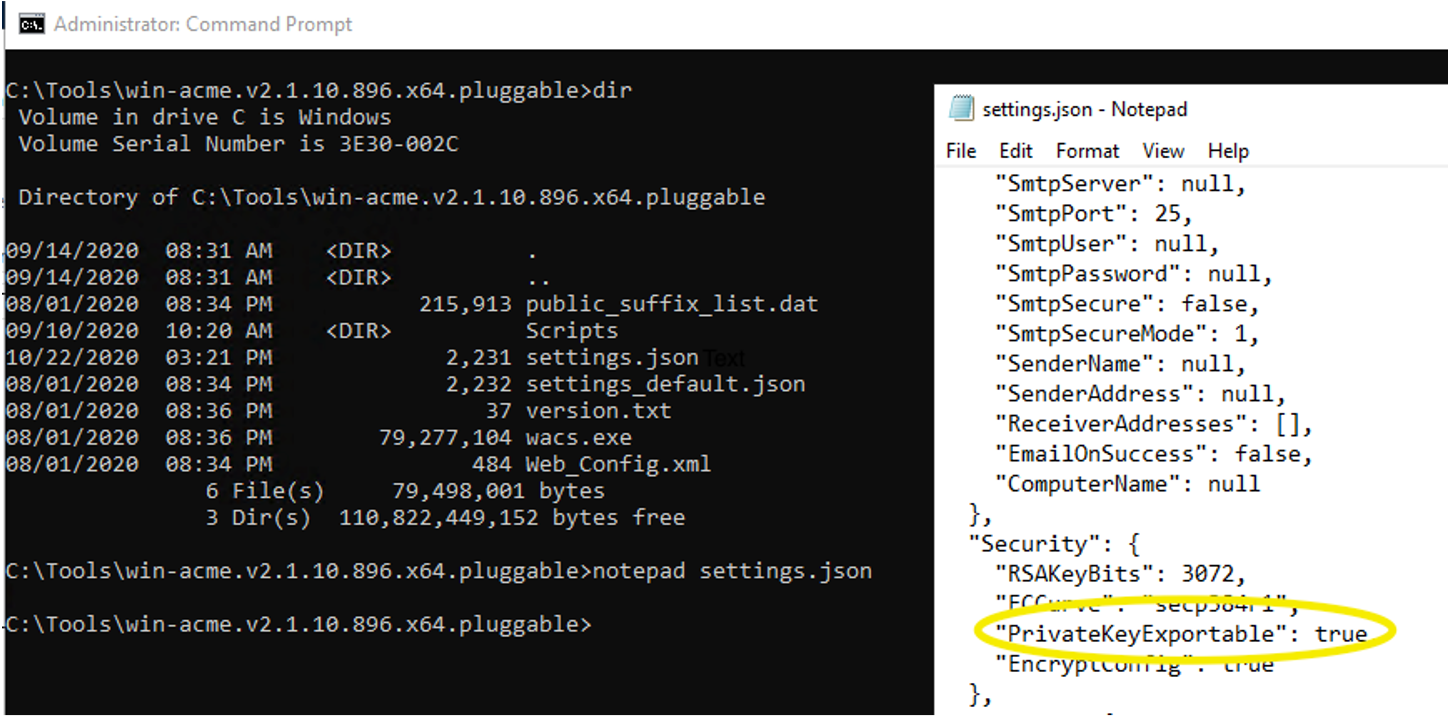
wacs.exe --renew --baseuri https://acme-v02.api.letsencrypt.org/ to renew a certificate.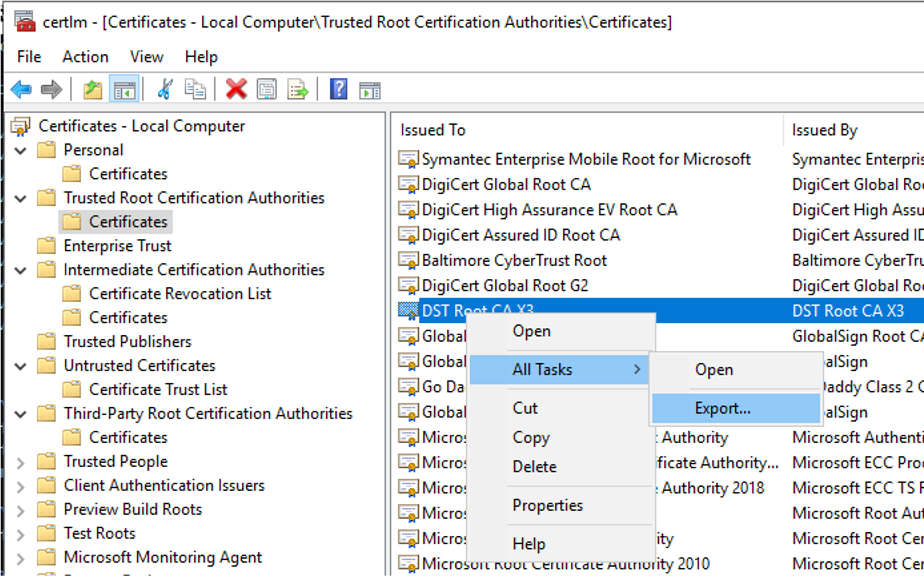
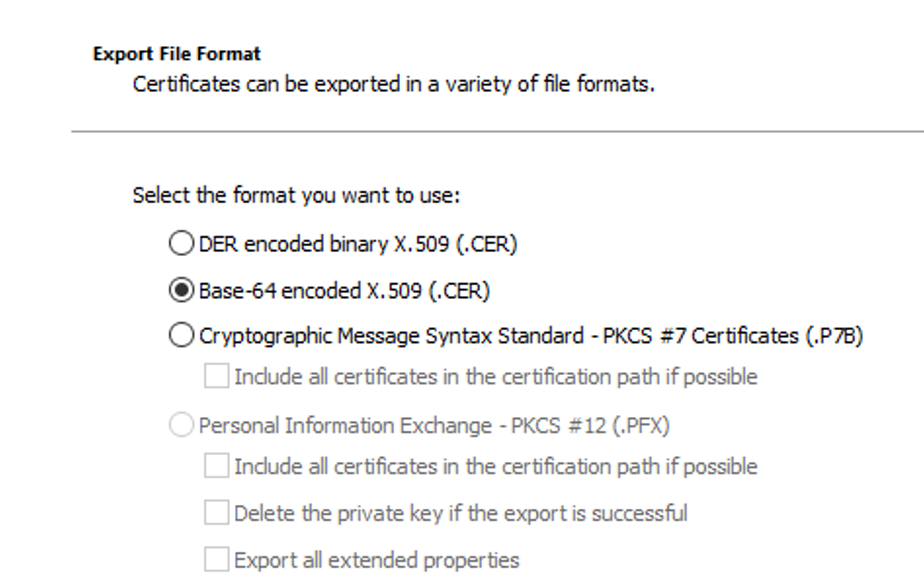
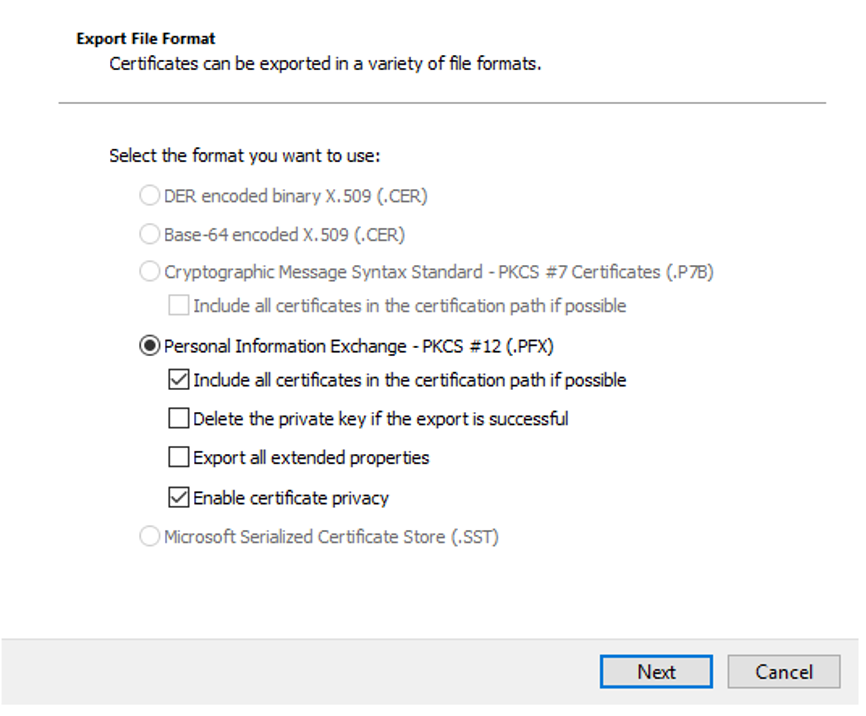
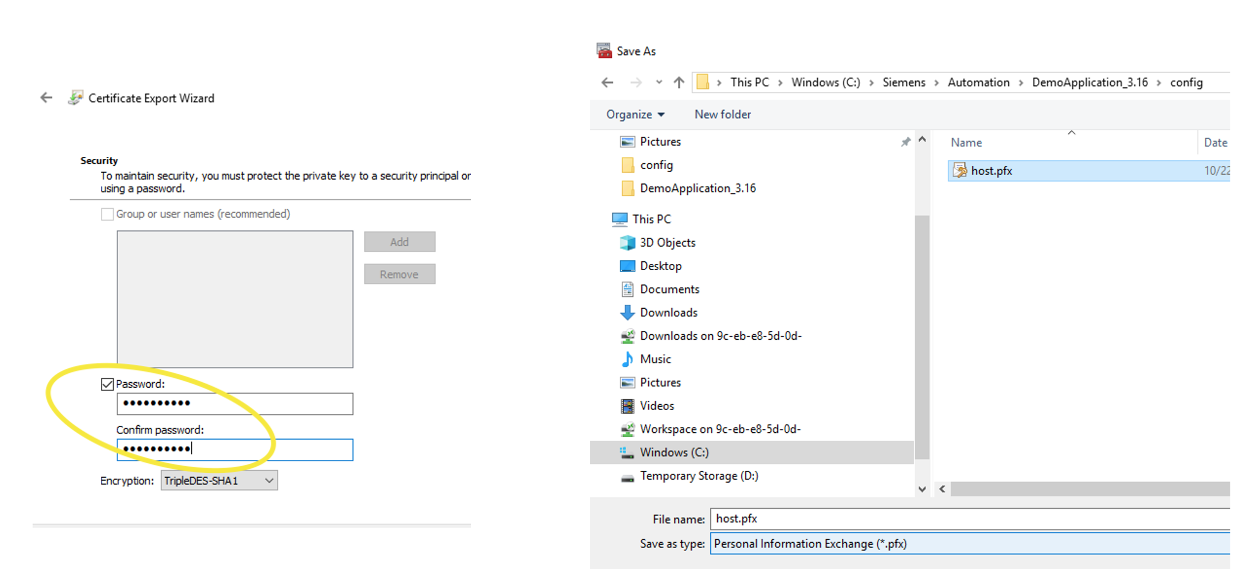
openssl pkcs12 -in [yourfile.pfx] -nocerts -out keyfile-encrypted.key
openssl rsa -in keyfile-encrypted.key -out privkey.pem
=> Save to config/privkey.pem

openssl pkcs12 -in [yourfile.pfx] -clcerts -nokeys -out certificate.pem
=> Save to config/certificate.pemHere is an OPC UA gateway with which you can access your OPC UA values via MQTT and GraphQL (HTTP). If you have an OPC UA server in your PLC, or a SCADA system with an OPC UA server, you can query data from there via MQTT and GraphQL (HTTP). In addition, the gateway can also log value changes from OPC UA nodes in an InfluxDB. The archived values can then also be queried via GraphQL.
Runs anywhere: Linux, Windows, Mac, …
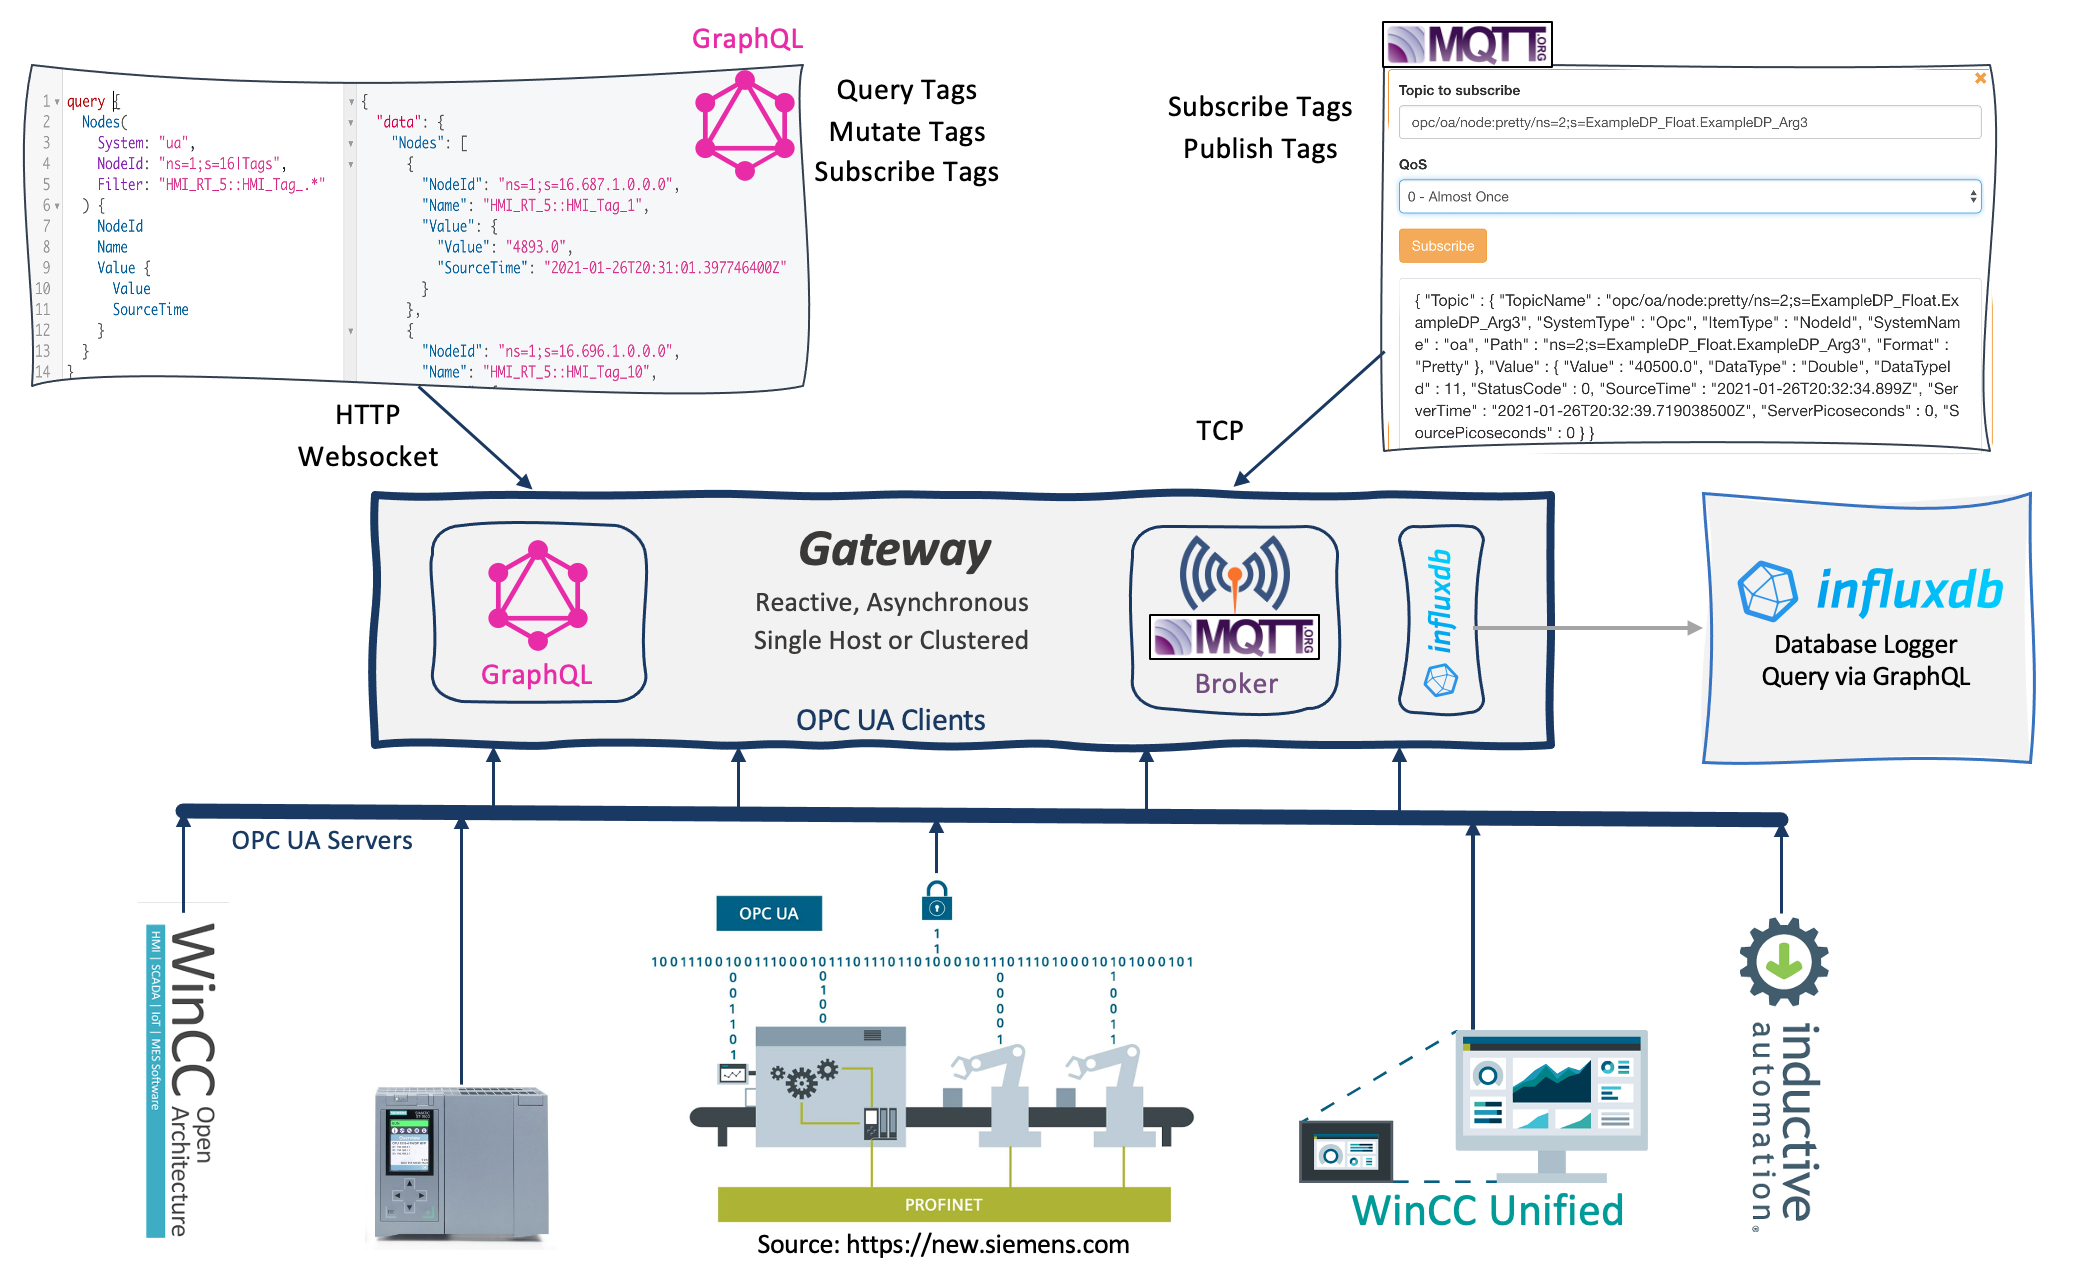
Example MQTT Client:
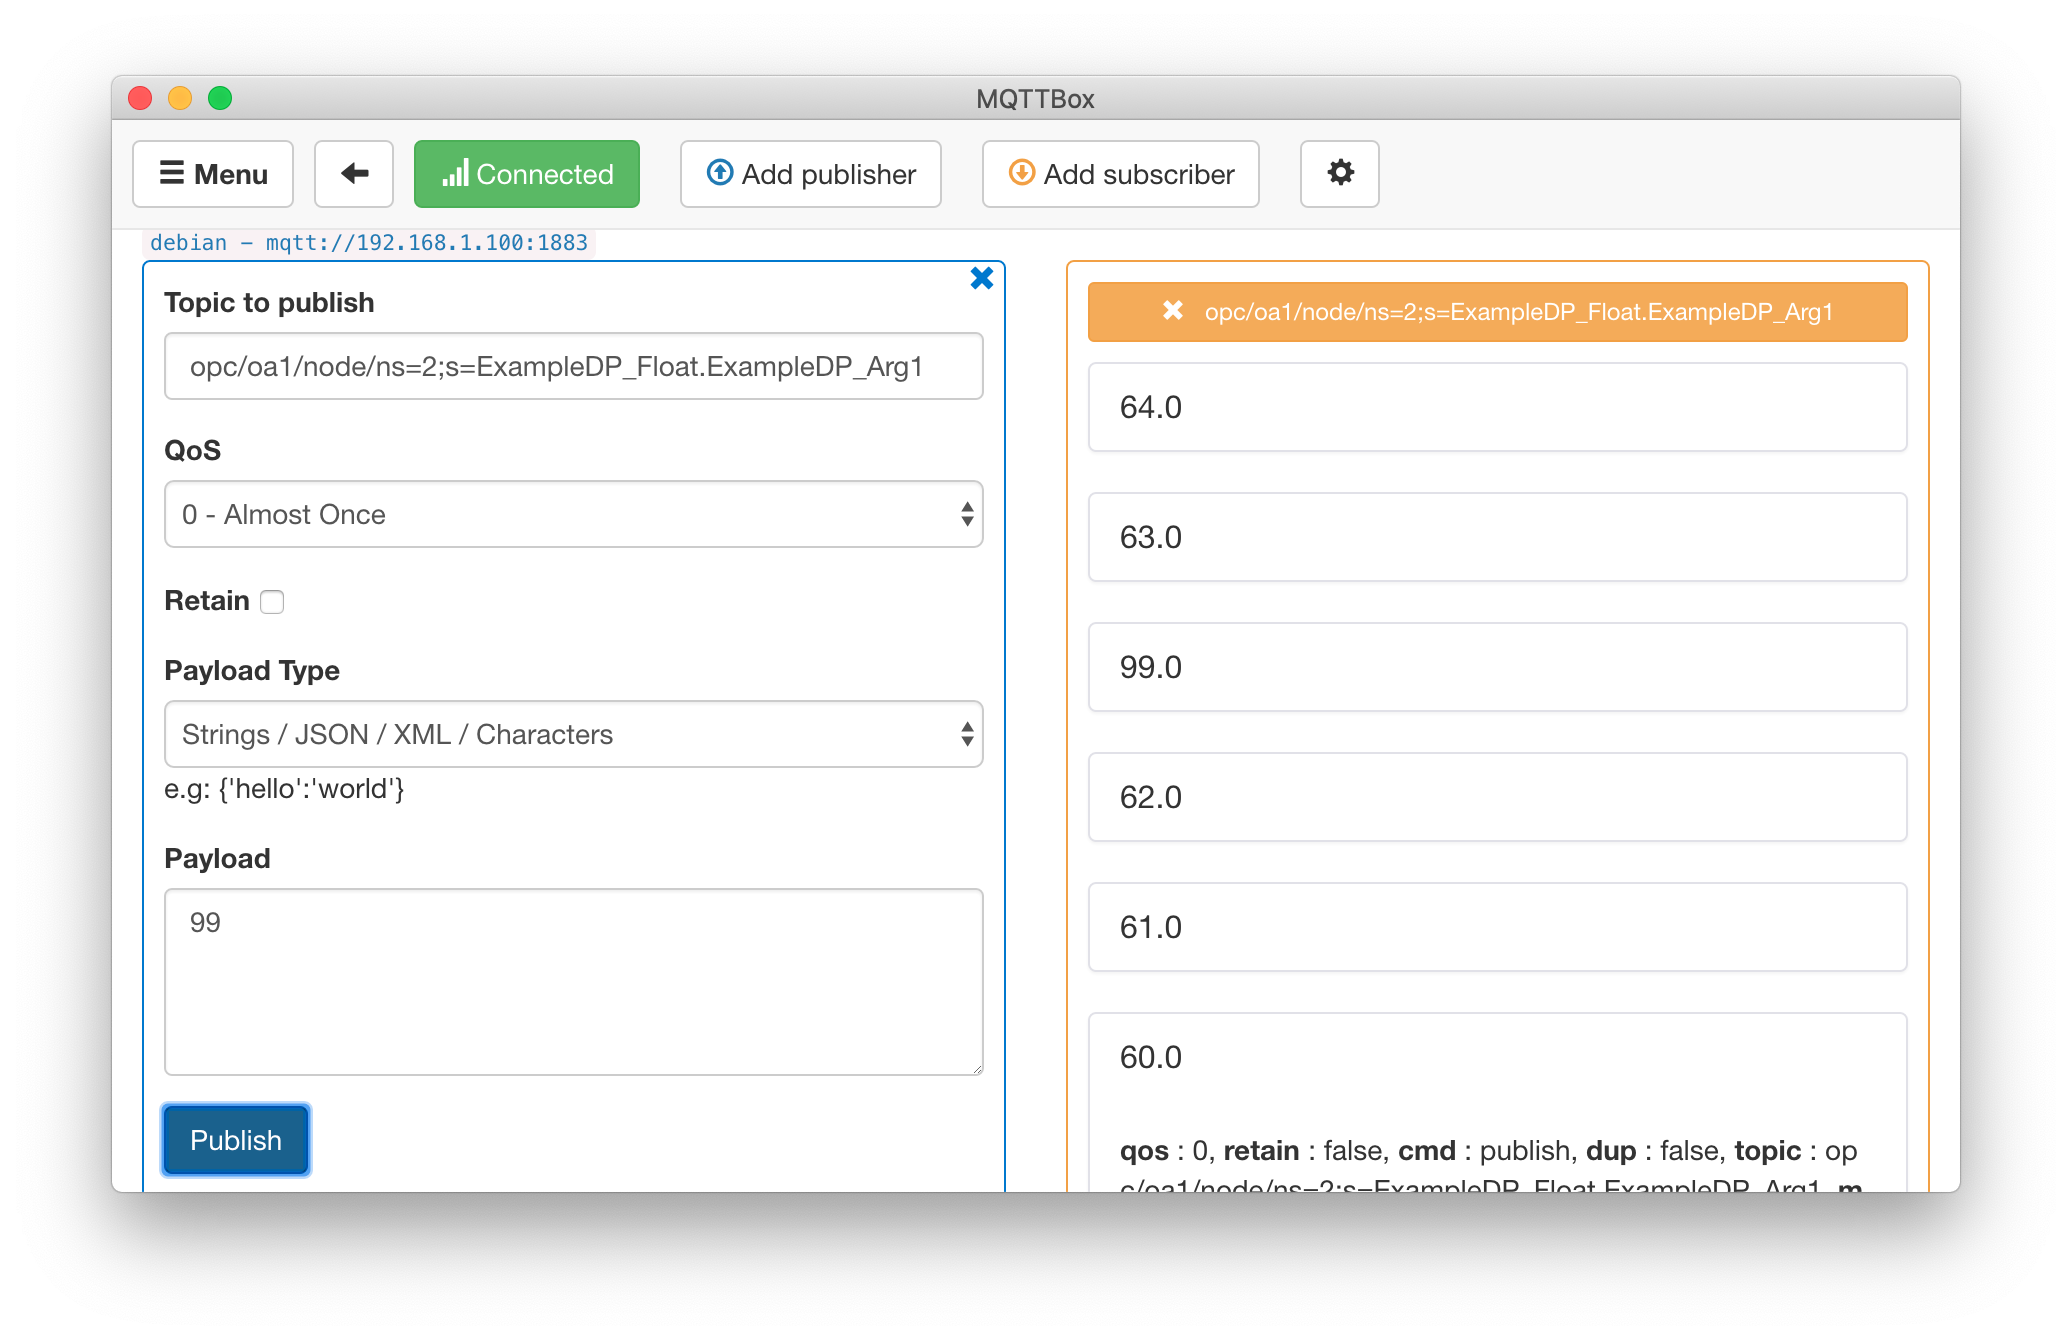
Example MQTT Topics:
opc/unified/node/1/16.687.1.0.0.0
opc/unified/node:Value/1/16.687.1.0.0.0
opc/unified/node:Pretty/1/16.687.1.0.0.0
opc/unified/path/Tags/HMI_Tag_3
opc/oa/node:Value/2/ExampleDP_Float.ExampleDP_Arg1
opc/oa/node:value/2/ExampleDP_Float.ExampleDP_Arg1
opc/oa/node:Json/2/ExampleDP_Float.ExampleDP_Arg1
opc/oa/node:json/2/ExampleDP_Float.ExampleDP_Arg1
Example GraphQL Queries:
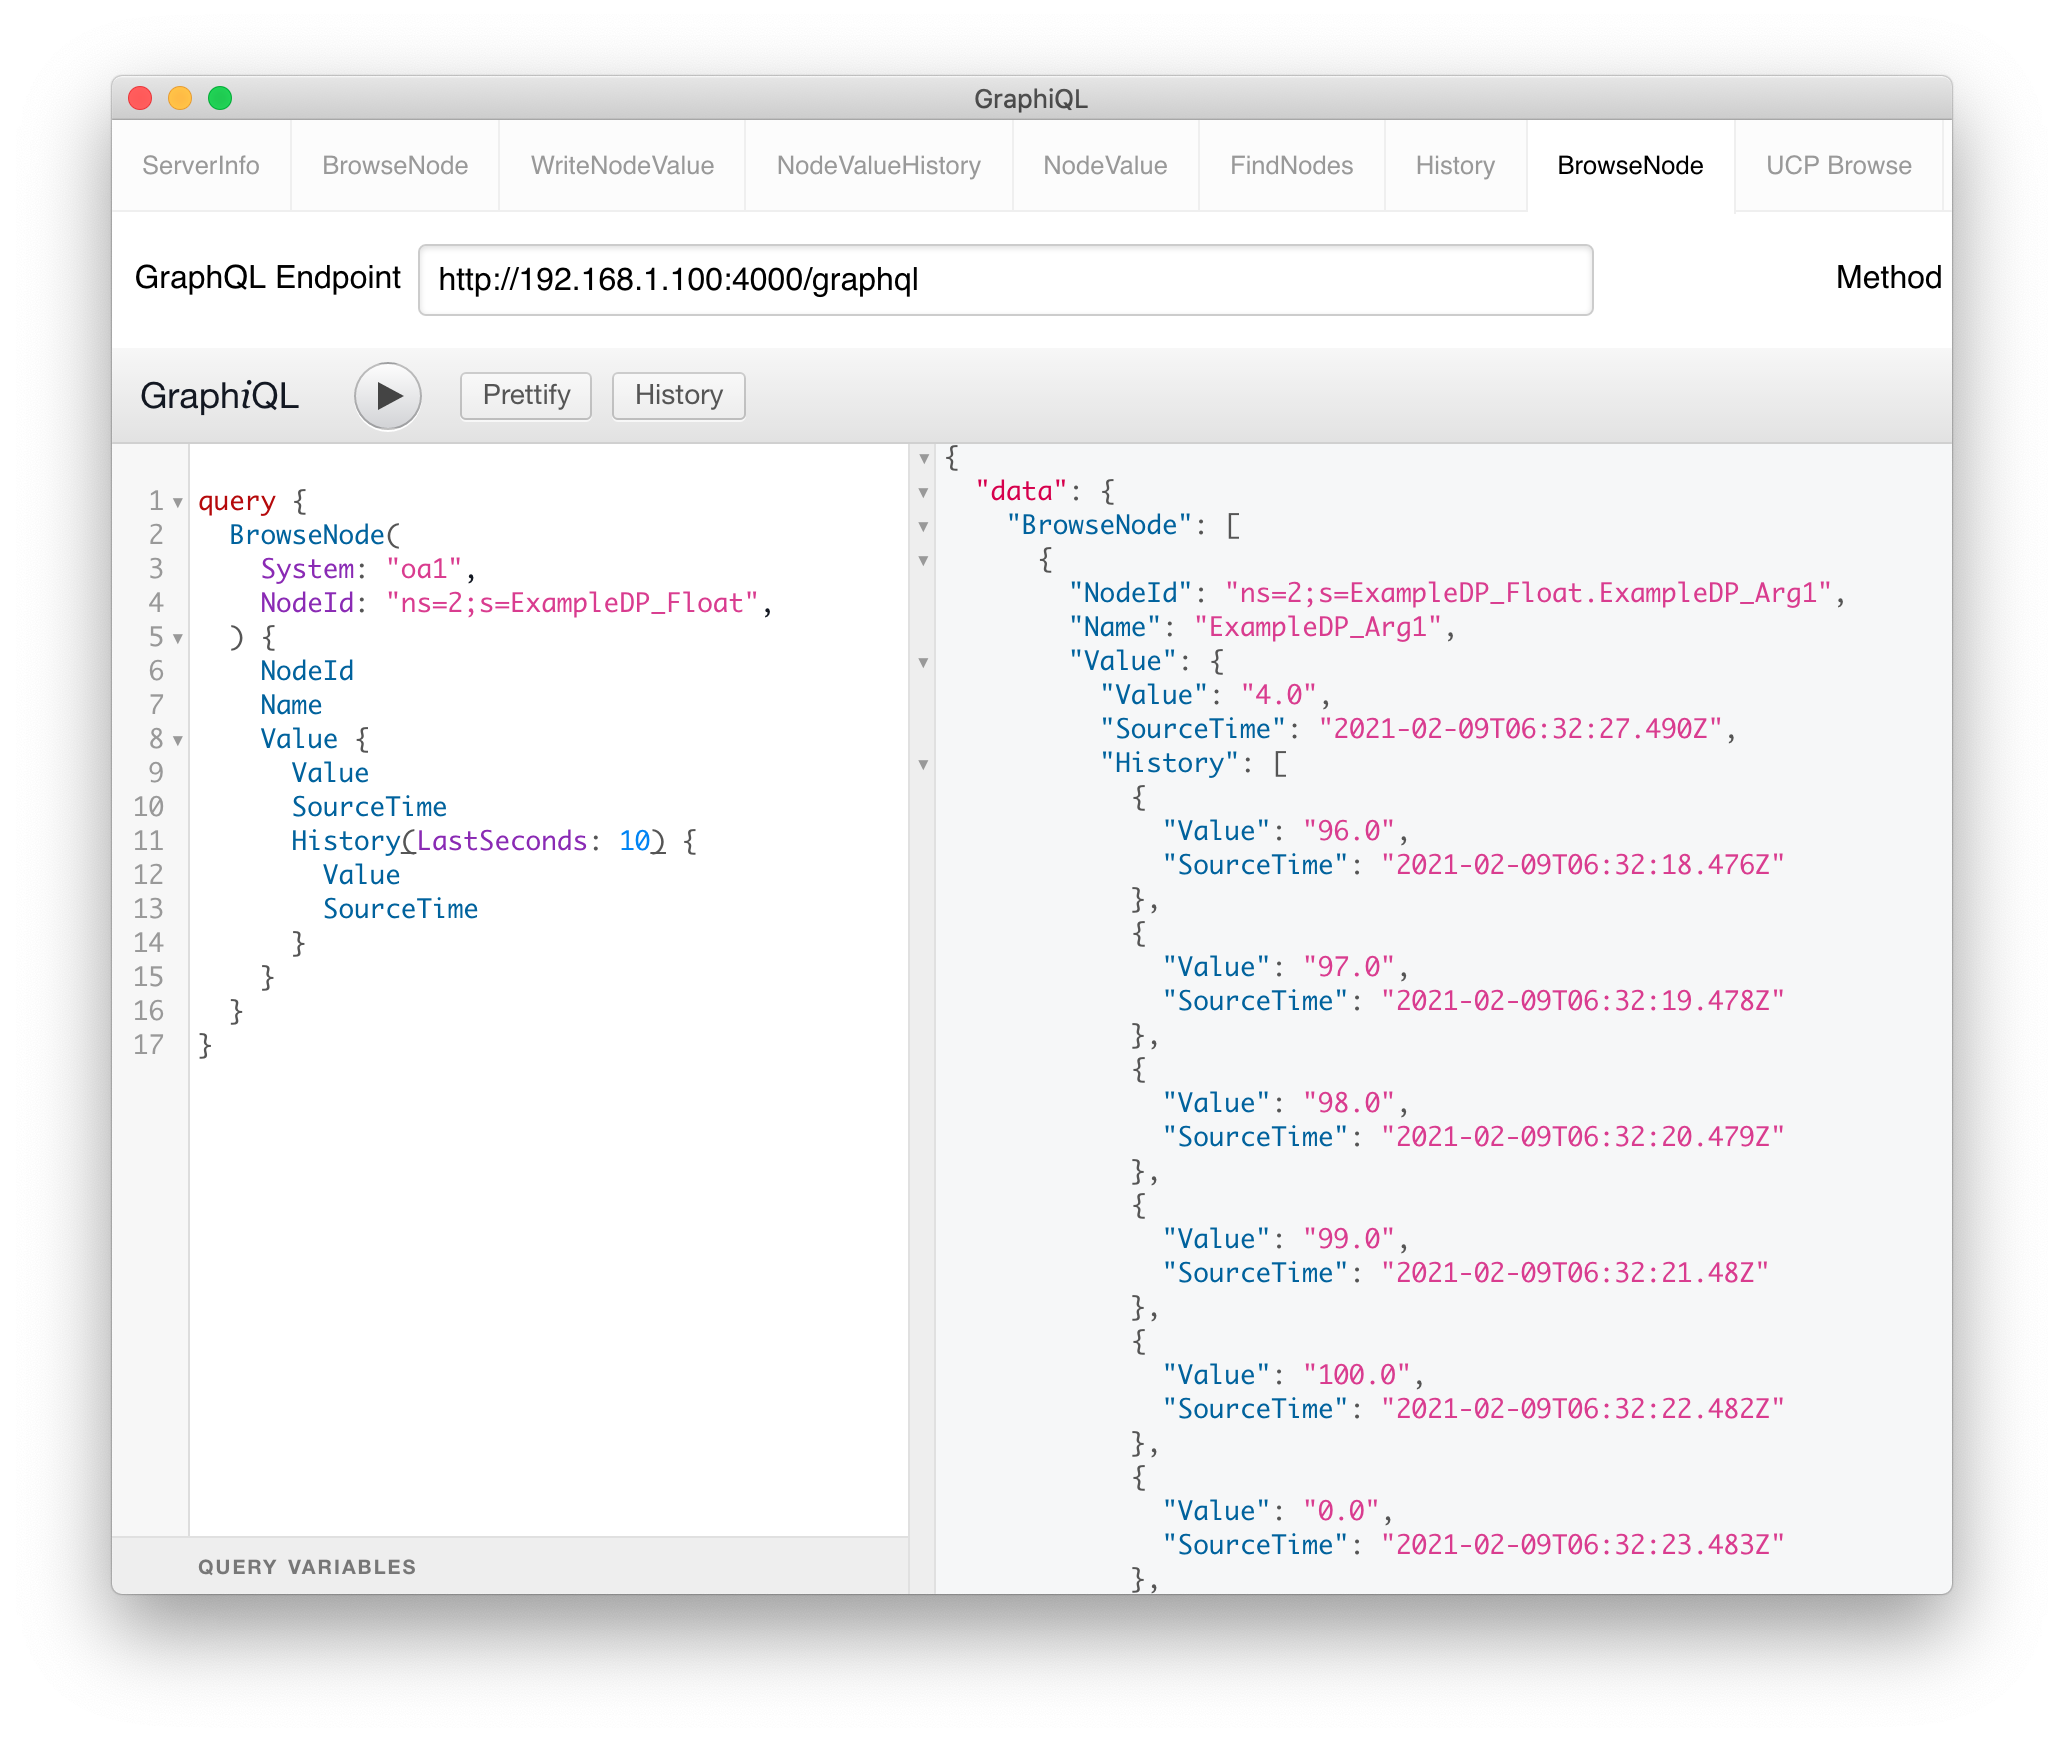
Here are some Videos/Demos:
sudo xattr -d com.apple.quarantine flutter/bin/cache/artifacts/usbmuxd/iproxy
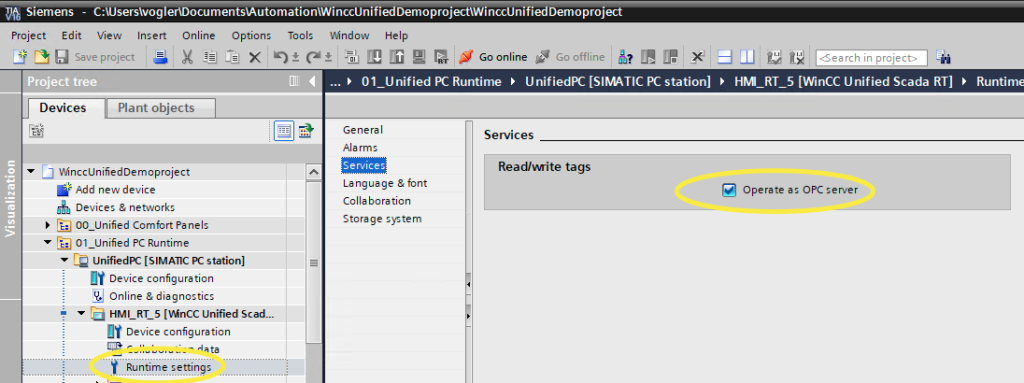
In the TIA Portal you have to enable “Operate as OPC Server” in the Runtime Settings of your project. Download and restart the runtime, and then the OPC UA Server is listening on opc.tcp://localhost:4890.
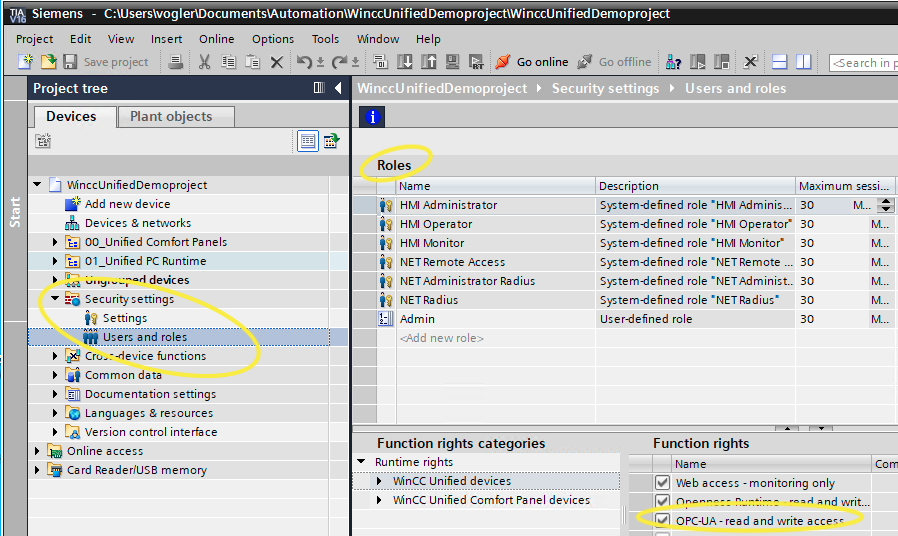
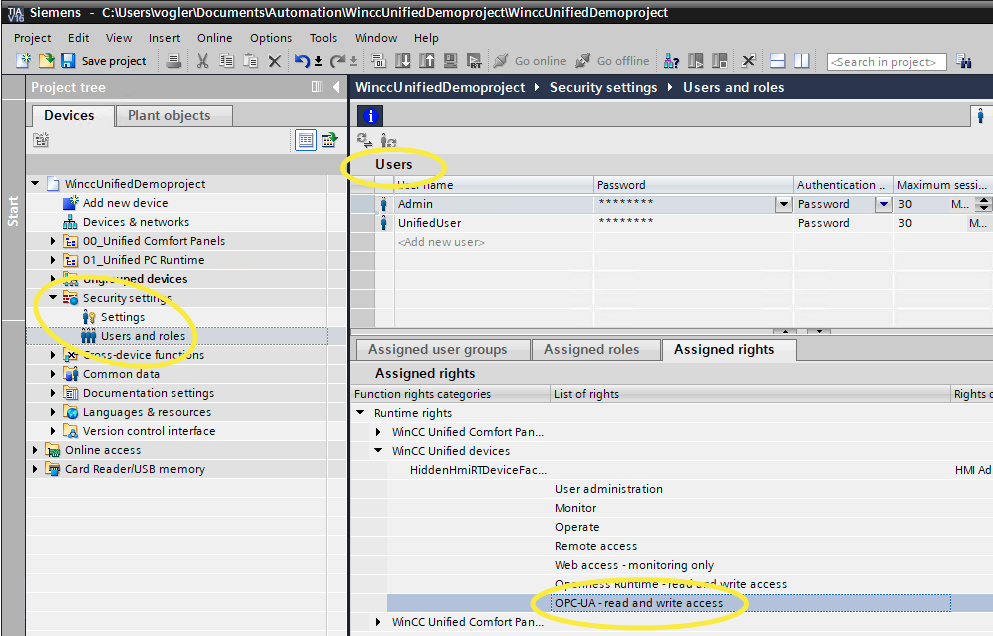
You need to have a user which has a role with the OPC-UA read and write access permission.
When you try to connect with a client the client will send the certificate to the server and typically the certificate is rejected by the server. To trust the certificate you have to move the certificate from the “Rejected” folder to the “Trusted” folder.
C:\Program Files\Siemens\Automation\WinCCUnified\bin\PKI\Rejected\certs
C:\Program Files\Siemens\Automation\WinCCUnified\bin\PKI\Trusted\certs
Caution! Don’t do this in a productive environment!
Add a security police “None” to the OPC UA configuration file.
On Windows you can find the file here: “C:\Program Files\Siemens\Automation\WinCCUnified\bin\OpcUaServerRTIL.xml”
<SecurityProfileUris>
<SecurityProfile>
<ProfileUri>http://opcfoundation.org/UA/SecurityPolicy#None</ProfileUri>
<Enabled>true</Enabled>
</SecurityProfile>
...
</SecurityProfileUris>